

Discovery is the disciplined process of building a verified, queryable inventory, dependency map, and risk profile that feed migration wave planning. Without it, you are estimating cloud costs against guesswork and scheduling cutovers around dependencies nobody has confirmed. The output is not a spreadsheet exercise — it is the foundation every downstream workstream depends on.
Start here: confirm your scope (which data centers, which applications, which business units), assign a migration lead and a discovery engineer, choose your collection method (agent-based, agentless, or hybrid), and secure credentials before a single scan runs. After an initial two-to-four-week discovery sprint, you need at minimum:
- A complete inventory CSV with server IDs, application IDs, owners, CPU/memory/storage specs, and utilization baselines
- A dependency graph showing service-to-service communication paths
- Criticality tags (Tier 1/2/3 or equivalent) on every application
AWS Prescriptive Guidance frames discovery as producing the migration metadata — server name, IP, OS, CPU, memory, storage, application mapping, and dependencies — that is the foundation for portfolio assessment and wave planning. That framing matters: discovery is outcomes-driven, not just a cataloging exercise.
Table of Contents
- Where does data center migration discovery fit in the migration lifecycle?
- What data should you collect during a data center assessment?
- Which discovery tools and methods should you use?
- How do you run a discovery sprint? A step-by-step runbook
- How do you convert discovery data into migration waves?
- How do you handle security and compliance during discovery?
- What are the most common discovery mistakes?
- What artifacts does discovery need to produce?
- How do you hand off discovery outputs to migration planning?
- Key Takeaways
- The part of discovery most teams underestimate
- IT-Magic’s migration discovery and planning services
- Useful sources
- FAQ
Where does data center migration discovery fit in the migration lifecycle?
Running this on your own AWS setup? IT-Magic is an AWS Advanced Tier Partner — we audit, fix, or fully manage it for you.
Get a free consultationThe AWS Migration Lens organizes large migrations into three phases: Assess, Mobilize, and Migrate/Modernize. Discovery lives in Assess, but its outputs are what make Mobilize possible. Without a complete inventory and dependency map, you cannot design a landing zone, estimate costs, or sequence waves.
The AWS Well-Architected Migration Lens maps the assess phase to six Well-Architected pillars and explains how discovery metadata informs migration pattern selection and landing-zone decisions. Practically, this means your discovery artifacts feed directly into three downstream workstreams: cost estimation (TCO modeling), security baseline design, and wave sequencing.
For long-running programs covering many servers, discovery is not a one-time event. Plan for a pilot wave including a small set of low-risk applications to validate your landing zone and processes, then refresh discovery data regularly as the program progresses. Applications change. New services get deployed. Batch jobs get added. Stale discovery data is one of the most common causes of cutover surprises.
The DCOI migration guide makes the same point at government scale: detailed discovery is required to refine and verify migration strategies using additional server and application data. The principle holds regardless of organization size.
What data should you collect during a data center assessment?
The short answer: more than most teams initially plan for. The fields below represent the minimum viable dataset for a migration. Missing any category creates gaps that surface as surprises during wave planning or cutover.
Server and VM identifiers
- Hostname, FQDN, IP addresses (primary and secondary), MAC address, asset tag
- Physical location (rack, cage, data center site)
- OS name, version, patch level, kernel version
- Firmware version (for physical hosts), hypervisor type and version
Hardware and VM sizing
- Physical CPU sockets, cores per socket, logical CPUs; vCPU allocation for VMs
- Total RAM, memory allocation, swap configuration
- Disk layout: total storage, partition sizes, filesystem types, mount points
- IOPS metrics: average and peak read/write IOPS, latency percentiles
- Network interface count, speed, and bonding configuration
Utilization metrics
Capture at least 30 days of telemetry for CPU utilization (average, 95th percentile, peak), memory utilization, disk throughput, and network throughput. Thirty days catches weekly batch cycles; 90 days catches month-end processing spikes.
Application and service details
| Field | Description |
|---|---|
| Application name and version | Canonical name, release version, vendor |
| Runtime environment | JVM version, .NET framework, Python version, Node.js version |
| Service ports | All listening TCP/UDP ports and bound interfaces |
| Startup scripts | Init scripts, systemd units, Windows services |
| Application owner | Named individual and business unit |
| SLA / criticality tier | Tier 1 (mission-critical), Tier 2 (business-important), Tier 3 (non-critical) |
| Maintenance window | Allowed downtime windows for cutover planning |
Databases
Type (Oracle, SQL Server, PostgreSQL, MySQL, MongoDB), version, instance size, total data size, replication topology, backup schedule, RTO and RPO targets, and whether the database is shared across multiple applications. Shared databases are the most common source of wave-planning conflicts.
Network and dependency data
VLANs, subnets, routing tables, NAT rules, firewall rule sets, load balancer VIPs, and DNS aliases. Capture NetFlow or sFlow data for at least two weeks to build empirical communication maps. Google Cloud’s Migration Center highlights that discovery data enables grouping for migration preferences and TCO reporting — network flow data is what makes accurate grouping possible.

Also collect: scheduled cron jobs and batch job schedules, NFS/CIFS mounts and file share dependencies, and any third-party API endpoints the application calls externally.
Security and operational metadata
Authentication mechanisms (Kerberos, LDAP, local accounts), encryption in transit and at rest, privileged service accounts found during scans, and data sensitivity classification (PII, PHI, PCI-scoped). Keep this metadata in a restricted artifact store — not in a shared spreadsheet.
For migrations involving physical facility moves or colocation consolidation, add power draw (kW per rack), cooling configuration, and PUE data. Vertiv’s data center assessment framework lists CFD modeling, PUE analysis, and power and cooling capacity as required deliverables when facility consolidation is in scope.
Which discovery tools and methods should you use?
No single method covers everything. The right approach is almost always a combination, chosen based on your environment’s complexity, your credential access, and how much time you have before the first pilot wave.
Agent-based discovery
Agents installed on each host deliver the deepest telemetry: OS-level process lists, service dependencies, file system details, and consistent utilization data over time. The tradeoff is deployment effort. In a 500-server environment, rolling out agents requires a change management process, compatibility testing across OS versions, and privileged access to install software. AWS Application Discovery Service supports an agent-based mode that collects detailed server configuration and performance data, including network connections, and feeds directly into AWS Migration Hub for portfolio tracking.
Agentless discovery
Agentless methods use existing protocols — WMI for Windows, SSH for Linux, SNMP for network devices — to query hosts without installing software. Faster to start, but coverage depends entirely on credential access and network reachability. Hosts behind strict firewall rules or with non-standard configurations often appear incomplete or not at all. AWS Application Discovery Service also offers an agentless collector (deployed as a VMware vCenter appliance) that works well for VMware-heavy environments.
Network-based methods
NetFlow and sFlow capture traffic metadata at the network layer, giving you empirical communication maps without touching individual hosts. This is especially valuable for discovering undocumented dependencies and shadow services that agents miss. Packet capture (PCAP) adds protocol-level detail but generates large data volumes — use it selectively for specific application tiers rather than environment-wide.
CMDB and existing inventory sources
Most organizations have a CMDB, but most CMDBs are partially stale. Use CMDB data as a starting point and a reconciliation target, not as ground truth. Run discovery tool output against CMDB records to find discrepancies: servers in the CMDB that do not respond to scans (decommissioned or moved), and servers that respond to scans but are not in the CMDB (shadow IT).
Tool comparison
| Method | Coverage depth | Deployment effort | Best for |
|---|---|---|---|
| Agent-based (AWS ADS, BMC Discovery) | High (OS, process, utilization) | High (install, credentials, change mgmt) | Complex apps, long programs |
| Agentless (WMI/SSH, AWS ADS agentless) | Medium (config, basic utilization) | Low-medium (credentials only) | VMware environments, fast starts |
| Network flow (NetFlow/sFlow) | Medium (communication patterns) | Low (network device config) | Dependency mapping, shadow IT |
| CMDB import | Low (often stale) | Low | Baseline and reconciliation |
| Offline CLI (Google mcdc) | Medium (inventory, guest data) | Low (CLI tool, no agent) | Air-gapped or restricted environments |
BMC Discovery and BMC Helix Discovery deliver particularly strong dependency modeling through their CMDB integration. BMC Discovery’s query language lets you extract modeled applications, database instances, communication paths, and business service relationships — all exportable for wave planning. Faddom takes a different approach: it maps infrastructure dependencies using network traffic analysis without agents, which TechCrunch noted positions it for heterogeneous environments where agent deployment is impractical. Google Cloud’s Migration Center discovery client (mcdc) supports offline inventory and guest discovery via CLI, useful for air-gapped environments or when you need a lightweight export for TCO assessment.
For high-fidelity coverage, combine agents on Tier 1 applications, agentless scanning for the broader server population, and two weeks of NetFlow capture. Add targeted owner interviews for any application where automated tools return incomplete dependency data.
Pro Tip: Store all discovery credentials in AWS Secrets Manager or HashiCorp Vault before the sprint starts. Never pass credentials in plain text through scan configuration files — discovery tools touch every host in scope, and a credential leak at this stage has wide blast radius.
How do you run a discovery sprint? A step-by-step runbook
Roles and responsibilities
| Role | Responsibility |
|---|---|
| Migration lead | Scope definition, stakeholder alignment, sprint governance |
| Discovery engineer | Tool deployment, scan execution, data validation |
| Application owner | Validates application inventory, confirms dependencies |
| Network SME | Configures flow capture, provides firewall rule access |
| Security SME | Reviews credential handling, approves data handling policy |
| CMDB owner | Provides baseline export, reconciles discrepancies |
| Data steward | Enforces retention policy, manages artifact access controls |
Sprint timeline
A focused pilot discovery sprint covering dozens of servers typically runs a few weeks. Full portfolio discovery for hundreds of servers typically requires multiple weeks with parallel workstreams.
Step-by-step checklist
- Define scope — List all data centers, IP ranges, and application portfolios in scope. Document what is explicitly out of scope to prevent scope creep.
How do you convert discovery data into migration waves?
Raw inventory data does not become a migration plan on its own. You need grouping rules, risk scoring, and pattern selection before you can sequence waves.
Grouping rules
Start with technical affinity: applications that share a database, a storage volume, or a network segment must move together. Then apply business grouping: applications owned by the same team with the same SLA can often share a cutover window, reducing coordination overhead. Finally, apply technology grouping: servers running the same OS version and middleware stack can use the same migration runbook, which reduces per-wave effort.
The Uptime Institute’s risk assessment guidance adds an important dimension: assess people and operational processes alongside technology. An application with a complex dependency map but a highly capable, available team carries less actual migration risk than a simpler application whose owner is unavailable during the cutover window.
Risk scoring dimensions
Score each application group across five dimensions:
- Data sensitivity: — PCI-scoped, HIPAA-covered, or PII-containing data
Score each dimension 1–3 and sum for a composite risk score. High-scoring groups go into later waves; low-scoring groups become your pilot candidates.
Migration pattern selection (the Seven Rs)
Map each group to one of the seven migration patterns: rehost (lift-and-shift), replatform (lift-and-reshape), refactor (re-architect), repurchase (move to SaaS), relocate (VMware to VMware Cloud), retire (decommission), or retain (keep on-premises). The AWS Migration Lens provides the framework for aligning pattern selection to Well-Architected pillars. For most large migrations, the majority of workloads start as rehost candidates, with replatform and refactor decisions deferred to post-migration optimization.
Wave planning outputs
Each wave needs: a roster of application groups, a cutover window, a rollback plan stub, provisional EC2/RDS sizing based on utilization data, and a target AWS account and region. Feed these directly into your migration step guide and landing-zone design.
How do you handle security and compliance during discovery?
Discovery tools are privileged. They authenticate to every host in scope, collect configuration data, and store it centrally. That makes the discovery process itself a security surface worth protecting.
Least-privilege and credential controls
Create dedicated service accounts for each discovery tool with the minimum permissions required: read-only WMI access for Windows inventory, read-only SSH for Linux, SELECT-only database credentials for DB inventory queries. Never reuse production admin accounts. Rotate credentials after the discovery sprint completes and revoke accounts that are no longer needed.
Store all credentials in a vault (AWS Secrets Manager, HashiCorp Vault, or CyberArk) and configure the discovery tool to retrieve them at runtime rather than storing them in configuration files. Maintain an audit log of every credential retrieval and every scan run.
Data minimization
Collect only what the migration requires. Discovery tools can capture a lot — running process lists, open file handles, browser history on poorly configured servers. Define a data collection policy before the sprint starts and configure tools to exclude categories that are not migration-relevant. This is especially important for HIPAA-covered environments, where incidental collection of PHI during a discovery scan creates a compliance obligation.
US regulatory considerations
For PCI DSS-scoped environments, tag every server in the cardholder data environment (CDE) during discovery and document the network segmentation boundaries. This data feeds directly into the target architecture’s network isolation design. For HIPAA-covered workloads, document where PHI resides, which applications access it, and what encryption controls are in place — discovery is the natural point to build this inventory. SOC 2 programs benefit from the access control and change management documentation that a well-run discovery sprint produces as a byproduct.
Tag sensitive assets in your inventory CSV with a data_sensitivity field (values: PCI, HIPAA, PII, Internal, Public). Wave planning tools and landing-zone designers use these tags to apply the right security controls before migration.
What are the most common discovery mistakes?
Shadow IT and missing owners
Signs: servers that respond to scans but have no CMDB record, applications with no named owner in any system of record, IP addresses that appear in flow data but not in your scan targets. Mitigation: cross-reference scan results against CMDB, Active Directory computer objects, and DNS records. For any unowned asset, escalate to the business unit most likely responsible based on network segment.
Stale CMDB data
A CMDB that has not been actively maintained for 12+ months will have 20–40% of records that do not match reality. Use it as a starting point, not a source of truth. Run discovery scans independently and treat discrepancies as findings that require resolution before wave planning begins.
Missing credentials or network blind spots
- Hosts that block WMI or SSH return empty inventory records — easy to miss in large scan batches
- Firewall rules that block the discovery tool’s scanning ports create silent gaps
- Network devices (switches, load balancers, firewalls) often require separate credential sets and SNMP community strings
- Mitigation: review coverage reports after every scan run; any host with less than 80% field completion needs manual follow-up
Over-collecting sensitive data
Discovery tools configured with broad permissions can inadvertently collect password hashes, private keys stored in config files, or database contents. Review tool configuration against your data handling policy before the first scan. Restrict output fields to what migration planning actually needs.
Analysis paralysis
Waiting for perfect discovery data before starting wave planning is the most expensive mistake. You will never have 100% complete data. Run a pilot wave with your best available data, migrate low-risk applications, validate the landing zone and runbook, and use what you learn to improve discovery depth for subsequent waves. Iterate, do not wait.
What artifacts does discovery need to produce?
The handoff from discovery to planning requires specific, structured outputs — not a collection of raw scan exports.
Inventory CSV schema
| Field | Type | Description |
|---|---|---|
| server_id | String | Unique identifier (hostname or asset tag) |
| app_id | String | Application identifier linked to this server |
| owner | String | Named application owner (email) |
| business_unit | String | Owning business unit |
| cpu_cores | Integer | Total logical CPUs |
| memory_gb | Float | Total RAM in GB |
| storage_gb | Float | Total provisioned storage in GB |
| avg_cpu_util | Float | 30-day average CPU utilization (%) |
| peak_cpu_util | Float | 30-day peak CPU utilization (%) |
| avg_mem_util | Float | 30-day average memory utilization (%) |
| business_criticality | String | Tier 1 / Tier 2 / Tier 3 |
| data_sensitivity | String | PCI / HIPAA / PII / Internal / Public |
| migration_pattern | String | Rehost / Replatform / Refactor / Retire / Retain |
| target_region | String | Proposed AWS region |
| wave_number | Integer | Assigned migration wave |
Dependency map
Export the dependency graph in GraphML or JSON edge-list format. Each node represents an application or service (attributes: app_id, hostname, tier, owner). Each edge represents a confirmed communication path (attributes: source_app_id, dest_app_id, port, protocol, flow_volume_mbps, confirmed_by). Include both automated (flow-derived) and manually confirmed edges.
Readiness report and risk register
The readiness report summarizes discovery coverage (% of servers with complete data), open credential gaps, unowned assets, and recommended pilot wave candidates. The risk register lists each identified risk with a description, affected application group, risk score, and proposed mitigation. Both documents require sign-off from the migration lead and security SME before wave planning begins.
For physical facility moves, include the power and cooling assessment outputs per Vertiv’s assessment framework: rack power draw, cooling capacity headroom, and PUE baseline.
Package all artifacts in a structured folder: inventory/, dependency-maps/, risk-register/, readiness-report/, and a README.md that lists every file, its schema version, the discovery tool that produced it, and the names of owners who signed off.
How do you hand off discovery outputs to migration planning?
The handoff is a gate, not a hand-wave. Before wave planning starts, confirm that every required artifact exists, every application has a named owner, and every Tier 1 dependency has been validated by a human.
Handoff checklist
- Inventory CSV complete with all required fields populated for 95%+ of in-scope servers
- Dependency graph exported and reviewed for obvious anomalies (isolated nodes, missing Tier 1 connections)
- Risk register reviewed and signed off by security SME
- Readiness report accepted by migration lead
- Open gaps documented with owners and resolution dates
- Pilot wave roster agreed with application owners
Feeding downstream workstreams
Cost estimation teams use the inventory CSV (CPU, memory, storage, utilization percentages) to generate EC2 and RDS right-sizing recommendations and TCO models. Landing-zone designers use the network topology data, security tags, and data sensitivity classifications to define VPC structure, security group policies, and encryption requirements. Automation engineers use the OS versions, runtime environments, and startup scripts to build migration runbooks. Google Cloud’s Migration Center documentation describes the same flow: discovery data enables grouping, migration preference generation, and TCO reporting.
Refresh cadence
For programs running longer than three months, re-run discovery scans every four to six weeks. Applications change. New services get deployed between discovery and cutover. A server that was idle during the initial scan may be running a new workload by the time its wave is scheduled. Treat discovery as a living dataset, not a one-time snapshot.
After the pilot wave, conduct a retrospective: which dependencies were missing from the discovery data? Which utilization figures were wrong? Use those findings to adjust scan configuration and interview depth for subsequent waves. This iterative approach is what separates programs that hit their timelines from those that do not.
Key Takeaways
Successful data center migration discovery requires verified inventory, empirical dependency mapping, and risk-scored groupings before a single server moves.
| Point | Details |
|---|---|
| Discovery is outcomes-driven | Produce inventory CSV, dependency graph, criticality tags, and risk register before wave planning starts. |
| Collect 30+ days of utilization data | CPU, memory, disk, and network telemetry over 30 days catches weekly batch cycles and prevents right-sizing errors. |
| Combine tools and interviews | Agent-based, agentless, and network flow methods each have blind spots; owner interviews catch scheduled jobs and tribal knowledge that automated tools miss. |
| Run a pilot wave early | Migrate low-risk applications first to validate landing-zone design and runbook accuracy before committing high-criticality workloads. |
| IT-Magic for discovery and migration | IT-Magic runs scoped discovery sprints, CMDB integration, dependency mapping, and pilot wave execution as part of its AWS migration engagements. |
The part of discovery most teams underestimate
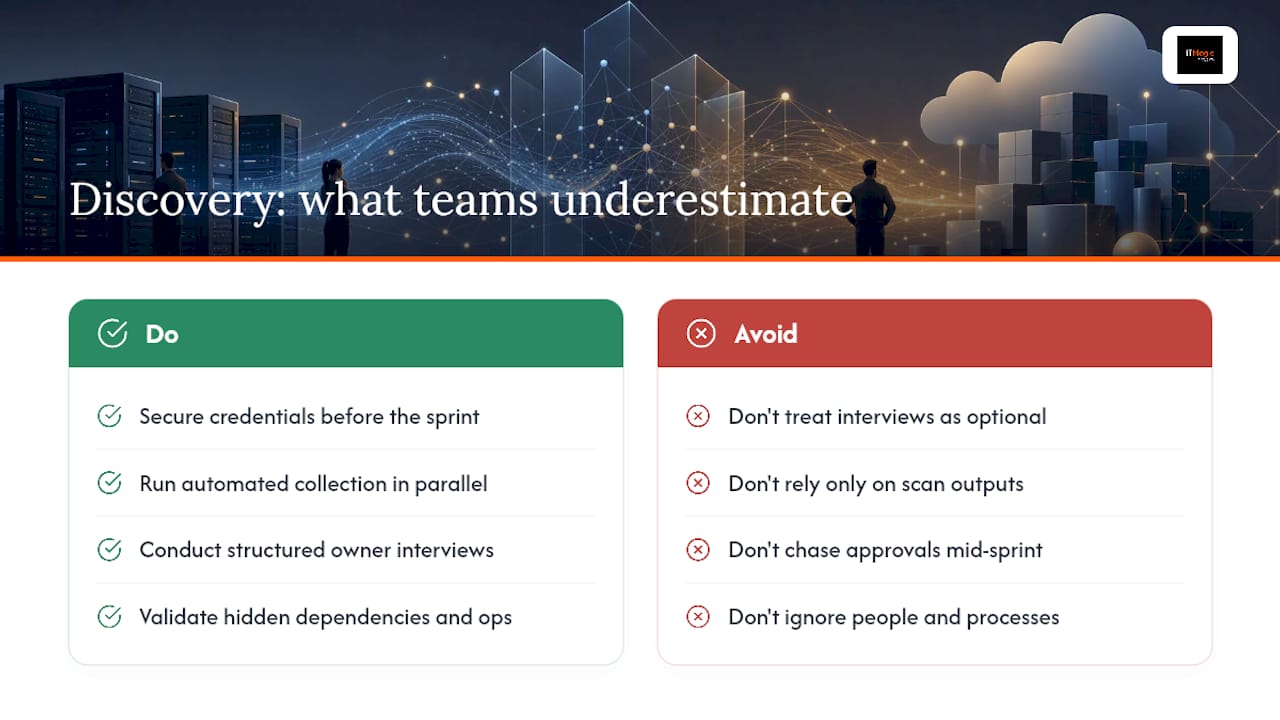
The technical mechanics of discovery — deploying agents, running scans, exporting CSVs — are the easy part. The hard part is getting application owners to validate what the tools produce.
Automated discovery tools are good at finding what is running. They are poor at explaining why it is running, what it depends on that is not visible on the network, and what will break if it moves on a Tuesday night. That knowledge lives in people, not in scan outputs. The Uptime Institute’s risk assessment guidance makes this explicit: a complete risk assessment must evaluate people and operational processes alongside technology. An application with a clean dependency map but an owner who has never participated in a DR test is a higher migration risk than the topology suggests.
The teams that run the smoothest migrations treat discovery as a two-track exercise: automated collection runs in parallel with structured owner interviews. The interviews are not optional and they are not a formality. They are where you find the nightly FTP job that runs from a server nobody scanned, the DNS alias that points to a load balancer that is not in the CMDB, and the vendor-managed component that requires 72 hours’ notice before any maintenance window.
Secure credentials before anything else. Not during the sprint, not the week before. Before. Credential gaps are the single most common reason discovery sprints run over schedule, and chasing down service account approvals mid-sprint burns time that should be spent on validation.
IT-Magic’s migration discovery and planning services
Running a discovery sprint well requires more than deploying a tool. It requires knowing which gaps to investigate, how to reconcile conflicting data sources, and how to translate a dependency graph into a defensible wave plan — the kind of judgment that comes from doing this across hundreds of engagements.
IT-Magic runs end-to-end AWS migration engagements that start with a scoped discovery sprint: CMDB integration, agent and agentless collection, dependency mapping, and pilot wave execution. The typical engagement moves from inventory and dependency analysis to landing-zone design, wave planning, and AWS cost optimization — so the migration pays for itself through right-sizing and reserved instance planning before the last server moves. As an AWS Advanced Tier Services Partner with 700+ projects delivered since 2010, IT-Magic brings certified expertise in DevOps, security, and networking to every phase of the migration. To scope a discovery engagement or get a migration assessment, contact IT-Magic at itmagic.pro.
Useful sources
The following references are worth bookmarking before your discovery sprint begins:
- Performing the initial discovery | AWS Prescriptive Guidance
- Migration Center discovery client CLI overview | Google Cloud
- Data center risk assessment | Uptime Institute
- DCOI migration guide.pdf
- Data center assessment (Vertiv)
- About infrastructure discovery and assessment | Migration Center | Google Cloud Documentation
- Faddom raises $12M to help companies map IT infrastructure | TechCrunch
For sample BMC queries and the mcdc CLI binary, use the AWS Prescriptive Guidance and Google Cloud links above — both provide downloadable examples and usage documentation. Treat these sources as templates to adapt, not point solutions to implement verbatim.
FAQ
What is the goal of data center migration discovery?
Discovery produces a verified inventory, dependency map, and risk profile that feed wave planning and cost estimation. Without it, migration sequencing and cloud sizing are based on assumptions rather than measured data.
How long does a discovery sprint typically take?
A focused pilot discovery sprint runs two to four weeks. Full portfolio discovery for hundreds of servers typically requires multiple weeks with parallel workstreams.
Should you use agent-based or agentless discovery?
Most environments benefit from a hybrid approach: agents on Tier 1 applications for deep telemetry, agentless scanning for the broader server population, and network flow capture for empirical dependency mapping. No single method covers every blind spot.
What is the minimum output discovery must produce before wave planning starts?
At minimum: a complete inventory CSV with utilization data, a dependency graph with validated edges for Tier 1 applications, a risk register, and a readiness report signed off by the migration lead and security SME.
How does IT-Magic support the discovery phase?
IT-Magic runs scoped discovery sprints that include CMDB integration, agent and agentless collection, dependency mapping, and pilot wave execution as part of its AWS migration engagements, with certified AWS expertise across DevOps, security, and networking.
Recommended
- Workload Migration for IT Teams: A 2026 Strategy Guide
- How to Migrate to AWS: A 2026 Step-by-Step Guide
- Migrating to Kubernetes on AWS: A Practical 2026 Guide
- AWS Optimization Checklist for Cloud Teams in 2026
Alexander founded IT-Magic, an AWS Advanced Tier Services Partner delivering DevOps, cloud architecture, and managed services since 2010. He holds:
- AWS Certified Solutions Architect – Professional
- AWS Certified DevOps Engineer – Professional
- AWS Certified Security – Specialty
- AWS Certified Advanced Networking – Specialty
Talk to a certified AWS team trusted by INTERTOP, Foxtrot, Pandora, and J.Hilburn.
Get a free consultation