

A cost model is a reusable mathematical framework that links project drivers to a defensible cost range — not a single number, but a structured calculation you can rerun as assumptions change. Use one whenever you need scenario analysis, whole-life costing, or a traceable audit trail. A single point estimate is fine for low-risk, well-understood repeat tasks where the scope is locked and no one needs to interrogate the math. For everything else, the DOE Cost Estimating Handbook, the GAO Cost Estimating and Assessment Guide (GAO-20-195G), and ICEAA’s estimating techniques all point to the same conclusion: build a model, document your assumptions, and run sensitivity analysis before you commit a number to a budget or a bid.
Key Takeaways
A cost model’s value comes from its reusability and documented assumptions — without those, it’s a static guess that can’t survive the first change request.
| Point | Details |
|---|---|
| Match method to phase | Use parametric for early concept, build-up for procurement bids, extrapolation for follow-on production. |
| Document every assumption | Each assumption needs a source and a date; undated assumptions can’t be challenged or updated. |
| Always run sensitivity analysis | Test labor rate, size metric, complexity driver, schedule, and escalation index before committing any number. |
| Include operational labor in cloud models | Engineering hours for optimization and monitoring are a material cost line, not a rounding error. |
| IT-Magic for AWS cost modeling | IT-Magic builds and calibrates cloud cost models, delivers BoE documentation, and supports peer review for AWS environments. |
Table of Contents
Running this on your own AWS setup? IT-Magic is an AWS Advanced Tier Partner — we audit, fix, or fully manage it for you.
Get a free consultation- What cost models actually contain — and how they differ from a point estimate
- The four primary cost-modeling methods and where each fits
- The math behind cost models: size metrics, cost drivers, and CERs
- How to build a defensible cost model step by step
- How to validate, calibrate, and quantify uncertainty
- Worked examples and a starter template
- Tools and references practitioners rely on
- Best practices and the mistakes that sink cost models
- Cloud cost modeling: what AWS telemetry actually tells you
- Why most cost models fail before they’re ever used
- IT-Magic brings cloud cost modeling from spreadsheet to production
- Sources
- FAQ
What cost models actually contain — and how they differ from a point estimate
A point estimate is an answer. A cost model is the reasoning behind the answer. A model does.
Model vs. estimate at a glance:
| Dimension | Cost model | Point estimate |
|---|---|---|
| Fidelity | Encodes drivers, logic, and assumptions | Single output value |
| Repeatability | Reruns instantly with new inputs | Requires manual rework |
| Auditability | Full traceability to data sources | Limited or none |
| Best use cases | Procurement, scenario analysis, whole-life costing | Low-risk, fixed-scope repeat tasks |
Every cost model contains the same core anatomy. Cost drivers are the variables that move the number — labor rates, complexity ratings, unit counts, utilization percentages. Cost elements are the line items being estimated: labor, materials, overhead, sustainment, disposal. Input parameters are the raw values you feed in: team size, schedule duration, hardware specs. The calculation logic is the set of equations or algorithms that transform inputs into outputs, often expressed as cost-estimating relationships (CERs). On top of that sit auxiliary adjustments: escalation indexes to convert base-year dollars to then-year dollars, risk reserves, and overhead allocation rules.
Model boundaries matter as much as the math. A model scoped to acquisition costs only will understate total program cost by a wide margin on any long-lived system. Whole-life models include operations, maintenance, upgrades, and disposal. Decide the scope before you build a single formula, and document it explicitly in your Basis of Estimate — because a model that silently excludes sustainment costs will mislead every decision it informs.
The four primary cost-modeling methods and where each fits
ICEAA’s guidance organizes the field around four core techniques. Choosing the wrong one for your program phase is one of the most common and expensive mistakes practitioners make.
Parametric (algorithmic/CER-based). You build or adopt statistical relationships between cost and measurable drivers, then plug in your project’s parameters. Fast, repeatable, and well-suited to early concept trades when detailed design data doesn’t exist yet. Requires a calibrated dataset — without it, you’re applying someone else’s constants to your project and hoping the context matches.
Analogy. You find one or more completed projects that resemble yours, document the similarities and differences, and adjust the historical cost accordingly. Works well in the concept and early-development phases when you have access to comparable actuals. The risk is selection bias: estimators tend to pick analogies that confirm the number they already expect.
Engineering build-up (bottom-up). You decompose the work into its smallest estimable elements, estimate each one, and roll up. Highest accuracy, highest effort, and only practical once the design is mature enough to support that level of detail. The go-to method for procurement bids and production planning.

Extrapolation from actuals. You take real cost data from work already completed on the same program and project forward using learning curves, throughput rates, or trend lines. Best for follow-on production runs and sustainment planning where you have a solid historical baseline.
A fifth category worth naming: knowledge-based or hybrid approaches, which combine two or more of the above. A parametric model calibrated with local actuals and validated against an analogy is more defensible than any single method alone.
- Parametric: best for early concept, option analysis, and rapid trades
- Analogy: best for concept and early development when comparables exist
- Build-up: best for procurement bids, detailed design, and production
- Extrapolation: best for follow-on units and sustainment
- Hybrid: best for high-value programs where a single method’s weaknesses are unacceptable
The math behind cost models: size metrics, cost drivers, and CERs
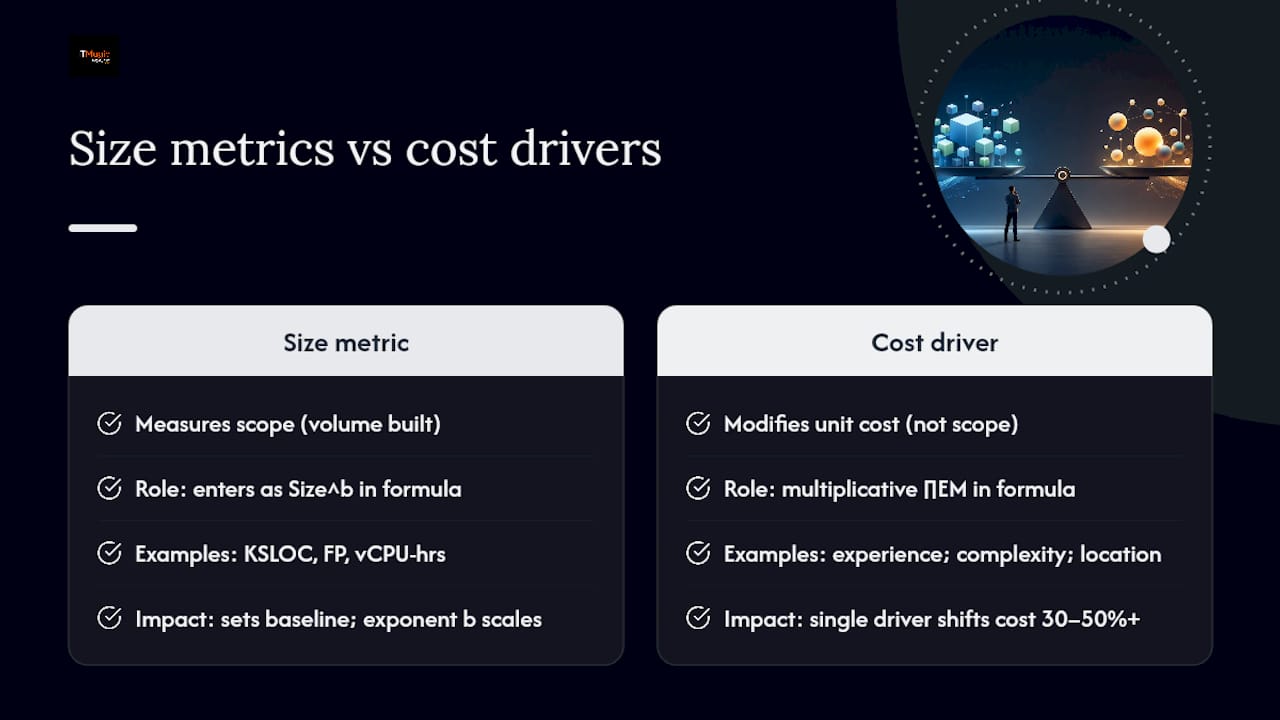
Size metrics and cost drivers are not the same thing, and conflating them produces broken models. A size metric measures the scope of what you’re building — lines of code, function points, weight, unit count, vCPU-hours. A cost driver modifies how expensive it is to produce that scope — team experience, complexity, reliability requirements, geographic location.
The generic parametric equation takes the form:
Cost = a × (Size)^b × ∏EM
Where a is a calibration constant, b is a scale factor (often slightly above 1.0 for software, reflecting diseconomies of scale), and ∏EM is the product of effort multipliers for each cost driver. The multiplicative structure means a single high-complexity driver can shift the total estimate by 30–50% or more.
COCOMO II, documented by the CMU Software Engineering Institute, is the most widely cited open parametric model for software. It uses KSLOC (thousands of source lines of code) or Unadjusted Function Points as its size metric, five scale factors that shape the exponent (including precedentedness and process maturity), and seventeen effort multipliers covering attributes like analyst capability, platform volatility, and required reliability. A project with high complexity and low team experience can carry a combined effort multiplier product well above 2.0, effectively doubling the baseline effort estimate. That sensitivity is exactly why running the model across a range of driver ratings — not just the most likely values — matters so much.
SEI explicitly warns that SLOC is a legacy metric that becomes unreliable for cloud-native or managed-service projects, where the meaningful size driver is operational consumption (requests per second, storage-GB-months, vCPU-hours) rather than code volume. Common size metrics by domain: software uses SLOC/KSLOC or function points; manufacturing uses unit count and weight; cloud workloads use vCPU-hours, storage-GB-months, and data transfer volumes.
Galorath’s SEER platform extends this structure by combining cost breakdown structure (CBS) and work breakdown structure (WBS) rollups with probabilistic outputs, so the model produces a confidence distribution rather than a single number. That’s the architecture behind most enterprise-grade parametric tools.
How to build a defensible cost model step by step
The UK Government’s Should Cost Modelling guidance describes a five-phase process that maps cleanly onto U.S. practice: plan, design, develop, test, and use. Here’s what each phase actually requires.
-
Plan. Define the model’s purpose, scope, and audience before writing a single formula. Who will use the outputs? What decisions will they inform? What’s the WBS or cost element structure? Identify your data sources and flag gaps early. Assign a model owner and a peer reviewer at this stage, not after the model is built.
-
Design. Write a model specification: inputs, outputs, calculation logic, and the assumptions that connect them. Decide which method fits your phase and data availability. Specify your escalation approach — the DOE Cost Estimating Handbook recommends using the DoD Green Book, CPI, or OMB indexes depending on the cost element and program type. Document the base year for all cost data.
-
Develop. Build the model. Instrument every input cell so it’s clearly labeled, sourced, and flagged if it falls outside a reasonable range. Separate inputs from calculations from outputs — a model where formulas and raw data share the same cells is a maintenance nightmare and an audit failure waiting to happen.
-
Test. Run unit tests on individual CERs. Check that the model produces known outputs for known inputs (backcasting against historical data is the most direct test). Have someone who didn’t build it try to break it. Peer review at this stage catches structural errors that the builder is too close to see.
-
Deliver. Produce a Basis of Estimate (BoE) that documents: the estimating method used for each element, the data sources and their vintage, all key assumptions, the escalation indexes applied, the model version and date, and the names of the peer reviewers. A BoE without reviewer names and data source citations is not a BoE — it’s a narrative.
Pro Tip: Every model should expose a minimal metadata block at the top: base year, calibration factor(s), BoE version number, data timestamp, and reviewer initials. With those five fields visible, anyone can re-baseline the model after a data update without rebuilding it from scratch — a practice the GAO Cost Estimating and Assessment Guide treats as essential for model traceability.
How to validate, calibrate, and quantify uncertainty
A model that hasn’t been calibrated is a hypothesis. Calibration is the step that turns it into an instrument.
Calibration techniques. If you have local historical data, use it. Regress your CERs against your own completed projects rather than published literature constants. Backcasting — running the model against past projects and measuring the residuals — tells you whether your equations are systematically high or low and by how much. When local data is thin, use published constants as a starting point but document the gap explicitly in the BoE.
Uncertainty methods. Three approaches, each suited to different situations:
- Deterministic sensitivity sweeps: vary one input at a time across a plausible range and record the output change. Fast, transparent, and easy to present to non-technical stakeholders. Best for identifying which drivers dominate the estimate.
- Monte Carlo / probabilistic analysis: assign probability distributions to key inputs and run thousands of iterations. Produces a full cost distribution with confidence intervals. Required for high-value programs and any procurement where you need to defend a contingency reserve.
- Confidence intervals from regression: when your CERs come from statistical regression, the regression itself produces prediction intervals. Use them.
Validation governance. The GAO requires sensitivity analysis and independent review as characteristics of a high-quality estimate. An Independent Cost Evaluation (ICE) — where a team with no stake in the program replicates or challenges the model — is the gold standard for major programs. For smaller efforts, a structured peer review with documented findings and dispositions satisfies most governance requirements.
Sensitivity checklist: test labor rate, productivity/complexity driver, size metric, schedule duration, and escalation index first. Those five levers explain the majority of variance in most cost models. Present sensitivity results as a tornado chart or as a simple table showing the output range for each input varied — stakeholders absorb that format quickly.
Worked examples and a starter template
Example 1: Parametric software estimate
A team is estimating a new internal tool at 15 KSLOC. Using a simplified COCOMO II-style CER with a baseline constant of 2.94 person-months per KSLOC^1.10, and a combined effort multiplier of 1.35 (reflecting above-average complexity and a moderately experienced team), the calculation runs:
Effort = 2.94 × (15)^1.10 × 1.35 ≈ 72 person-months
At a fully loaded labor rate of $12,000 per person-month, that yields a labor cost estimate of approximately $864,000. This is an illustrative calculation using simplified constants — a production model would use calibrated local constants and a full set of COCOMO II scale factors and effort multipliers.
Example 2: Cloud workload whole-life model
A mid-size application runs 120 vCPU-hours/day and 4 TB of storage. The table below shows a simplified run-rate vs. whole-life view (illustrative inputs only):
The engineering labor line — often omitted from cloud cost models — represents a significant portion of the three-year total in this example. That’s the number that surprises most teams the first time they build a whole-life model.
Template essentials. A minimal model spreadsheet needs four tabs: (1) Inputs and assumptions, with source citations in adjacent cells; (2) Calculation engine, with CERs and driver logic; (3) Outputs and scenarios, showing point estimate plus sensitivity range; (4) BoE summary, with method, data vintage, escalation index, and reviewer sign-off. The DOE Cost Estimating Handbook provides a BoE template that maps directly onto this structure.
Tools and references practitioners rely on
The market for cost-modeling tools splits roughly into open/academic models, commercial parametric platforms, and cloud-native cost tools.
- COCOMO II — (open, USC/SEI-documented): the reference parametric model for software. Free to use, well-documented, and widely understood by reviewers. Requires calibration for modern cloud-native or agile projects where SLOC is a poor size proxy.
- SEER-SEM — (Galorath): a commercial parametric platform for software and systems. Includes a calibrated knowledge base, CBS/WBS rollup, and probabilistic outputs. Widely used in defense and aerospace programs.
- AWS Compute Optimizer: analyzes CloudWatch utilization metrics and recommends right-sized instance types. The AWS Well-Architected Framework recommends using Compute Optimizer alongside CloudWatch telemetry to build workload-level cost models with the correct granularity and analysis period. Pair it with AWS Cost Explorer and Trusted Advisor for a complete cloud cost picture.
- GAO Cost Estimating and Assessment Guide (GAO-20-195G) — the standard reference for federal program cost estimates. Its twelve characteristics of a high-quality estimate are a useful checklist for any sector.
Best practices and the mistakes that sink cost models
The difference between a model that gets used and one that gets ignored usually comes down to a handful of governance decisions made early.
Best practices:
- Document every assumption with a source and a date. An undated assumption is an assumption no one can challenge or update.
- Version-control the model file. A model named “final_v3_REVISED_USE_THIS_ONE.xlsx” has already failed.
- Align the model structure to the program’s WBS or cost element structure. Outputs that don’t map to the budget structure require manual translation and introduce errors.
- Budget labor for model maintenance. A model that no one has time to update becomes wrong faster than you think.
- Require peer review before any model output goes into a procurement document or a budget submission.
Common mistakes:
- Ignoring indirect costs and overhead. Direct labor is rarely more than 60–70% of total program cost on complex projects. A model that omits burden rates understates cost materially.
- Mis-specifying the size metric. Using SLOC for a microservices project, or headcount for a cloud workload, produces a number that looks precise and is structurally wrong.
- Treating the first estimate as immutable. Estimates should be updated at each program phase gate as design matures and actuals accumulate.
- Skipping sensitivity analysis. A model that produces only a point estimate without a range is telling you less than it knows.
- Confusing model complexity with model quality. A 50-tab spreadsheet with undocumented formulas is harder to audit and easier to break than a clean, well-structured 4-tab model.
Operational governance. Assign a named model owner who is accountable for refresh cadence — typically at each phase gate and whenever a major input changes. Feed model outputs into the budgeting system through a documented interface, not a manual copy-paste. For procurement use, the UK Government’s Should Cost Modelling guidance recommends disclosing when a cost model has been used in supplier evaluation — a transparency practice worth adopting regardless of jurisdiction.
Cloud cost modeling: what AWS telemetry actually tells you
Cloud cost models fail in a predictable way: they capture the provider bill and ignore everything else. A complete cloud cost model includes three categories of cost that the bill alone won’t show you.
The first is compute and storage at the right granularity. AWS Well-Architected guidance recommends modeling at the workload level, using peak or 99th-percentile utilization rather than averages, and selecting an analysis period long enough to capture seasonal or batch cycles. Compute Optimizer pulls CloudWatch utilization data and surfaces right-sizing recommendations that feed directly into your model’s size inputs.
The second is commitment discount modeling. On-demand rates are rarely what you’ll pay at scale. A model that doesn’t include a commitment strategy scenario is incomplete for any workload running more than a few months.
The third is operational labor. This is the line item most teams omit. Managing, monitoring, right-sizing, and optimizing a cloud environment requires engineering hours. According to AWS Well-Architected cost optimization guidance, teams that build explicit engineering-hour line items into their cloud TCO models often find that operational labor represents a material share of the total savings workstream — a figure that surprises stakeholders who assumed cloud optimization was essentially free.
Cloud cost model checklist:
- Pull utilization data from CloudWatch and Compute Optimizer before sizing any compute line item
- Use peak/99th-percentile utilization for capacity planning; use average for run-rate cost
- Model at least three scenarios: on-demand, Reserved Instance/Savings Plan, and spot where applicable
- Include a named engineering-labor line item with hours and a fully loaded rate
- Set the analysis period to capture at least one full workload cycle (monthly batch, seasonal traffic peak)
- Tag resources by workload in AWS before modeling — untagged resources produce unattributable costs
- Feed model outputs into your AWS budgets and cost allocation tags for ongoing variance tracking
For GPU workloads specifically, right-sizing decisions carry outsized cost impact — a topic covered in detail in IT-Magic’s GPU instances AWS cost optimization guide. For broader AWS cost governance, the AWS cost optimization best practices guide covers tagging strategy, budget alerts, and integrating optimizer outputs into financial planning.
Why most cost models fail before they’re ever used
The failure mode I see most often isn’t a math error. It’s a governance error: the model gets built, reviewed once, filed, and never touched again. Six months later, labor rates have changed, the cloud provider has repriced a service tier, and the program has pivoted — but the model still shows the original numbers. Nobody updated it because nobody owned it.
The organizations that get real value from cost modeling treat models as living instruments embedded in decision gates. Before a procurement goes out, the model gets refreshed. Before a budget is submitted, the sensitivity analysis gets rerun. Before a make-or-buy decision is finalized, the whole-life model gets a peer review. That cadence is what separates a model that improves outcomes from one that just provides cover for a decision already made.
There’s a second failure mode worth naming: over-engineering the model for the decision at hand. A $200,000 internal project does not need a Monte Carlo simulation and a calibrated parametric platform. DOE and ICEAA both make this point explicitly: match model complexity to program criticality. The discipline is knowing which situation you’re in.
IT-Magic brings cloud cost modeling from spreadsheet to production
Cloud cost modeling is where good intentions most often stall. You have the Compute Optimizer recommendations, the CloudWatch data, and a spreadsheet that’s already three versions out of date. What’s missing is the structured model that ties telemetry to a defensible whole-life TCO, with a BoE your finance team can actually sign off on.
IT-Magic builds, calibrates, and operationalizes cloud cost models for AWS environments — covering compute right-sizing, commitment strategy modeling, operational labor costing, and BoE documentation. The work is grounded in AWS Well-Architected practices and delivered by certified AWS engineers who have run this process across 700+ projects for 300+ clients since 2010.
The INTERTOP engagement is a concrete example: IT-Magic delivered measurable cloud cost reductions through architecture changes and right-sizing, documented in the INTERTOP AWS cost reduction case study. If you’re building a cost model for an AWS workload or need a peer-reviewed BoE before a procurement or budget cycle, contact IT-Magic to scope the engagement.
Sources
These are the primary references practitioners should consult when building, validating, or citing cost models in procurement and budget documentation.
- Basis of Estimate Template / DOE Cost Estimating Handbook (Sept 2023 rev)
- GAO Cost Estimating and Assessment Guide (GAO-20-195G)
- Software Cost Estimation Explained | CMU Software Engineering Institute
- AWS Well-Architected Framework — cost modeling guidance
- Cost Estimating Techniques (ICEAA guidance)
When citing these sources in a BoE or procurement document, reference the document title, issuing organization, and publication or revision date. For government submissions, GAO and DOE guidance carry the most weight with reviewers. For cloud cost models, AWS Well-Architected citations signal that the methodology follows a recognized framework.
FAQ
What is a cost model?
A cost model is a reusable mathematical framework that links measurable project drivers to a cost range, allowing scenario analysis and sensitivity testing. Unlike a single point estimate, it encodes the assumptions and logic behind the number so it can be rerun as inputs change.
What are the main types of cost models?
The four primary types are parametric (algorithm-based CERs), analogy (adjusted historical comparables), engineering build-up (bottom-up element rollup), and extrapolation from actuals (trend projection from completed work). Most high-value programs use a hybrid of two or more methods.
Can you give an example of a cost model?
COCOMO II is a widely used parametric software cost model: it takes a size input in KSLOC, applies scale factors and effort multipliers for complexity and team attributes, and produces a person-months estimate. A simplified calculation for a 15 KSLOC project with a 1.35 combined effort multiplier yields roughly 72 person-months.
What is a cost model in accounting?
In accounting and financial management, a cost model refers to the structured framework used to allocate and forecast costs across a product, project, or asset — covering direct costs, overhead, escalation, and whole-life expenses. It differs from a budget in that it is recalculated as assumptions change rather than fixed at period start.
How do cost models support strategic decisions beyond budgeting?
Cost models inform make-or-buy decisions, pricing strategy, and procurement evaluation by showing how total cost shifts under different scenarios. A whole-life model that includes operational labor, sustainment, and disposal often reverses a decision that looked obvious when only acquisition cost was considered.
Recommended
- Cloud cost optimization strategies for CIOs: a practical guide
- SageMaker vs EKS for ML: Which Platform Wins?
- AWS Management Tools for Engineering Leaders: Choose by Category
- Hetzner vs AWS: A Practical Guide for Engineering Teams
Alexander founded IT-Magic, an AWS Advanced Tier Services Partner delivering DevOps, cloud architecture, and managed services since 2010. He holds:
- AWS Certified Solutions Architect – Professional
- AWS Certified DevOps Engineer – Professional
- AWS Certified Security – Specialty
- AWS Certified Advanced Networking – Specialty
Talk to a certified AWS team trusted by INTERTOP, Foxtrot, Pandora, and J.Hilburn.
Get a free consultation