
Run OpenTelemetry on AWS by standardizing on the AWS Distro for OpenTelemetry (ADOT) Collector with OTLP SDKs, then routing signals to Amazon CloudWatch (metrics and logs), AWS X-Ray (traces), or Amazon Managed Service for Prometheus (AMP) for PromQL workloads. For most teams, deploy the ADOT Collector as a sidecar on ECS/EKS or a daemon on EC2, and let it handle all export routing.
Required components to get started:
- ADOT Collector — AWS-supported OpenTelemetry Collector distribution
- OTLP SDKs — language-specific instrumentation libraries for your application
- CloudWatch agent — optional OTLP bridge for existing agent deployments or non-instrumented workloads
- AWS X-Ray — trace backend for distributed tracing
- Amazon Managed Service for Prometheus (AMP) — PromQL-compatible metrics store for high-cardinality workloads
Key Takeaways
The most reliable OpenTelemetry setup on AWS uses ADOT Collector as the central pipeline, routing metrics to CloudWatch or AMP, traces to X-Ray, and logs to CloudWatch Logs with EMF.
| Point | Details |
|---|---|
| Use ADOT as your Collector | ADOT adds AWS resource metadata automatically, reducing time to correlate app and infra issues. |
| Match deployment pattern to workload | Sidecar for EKS/Fargate, daemon for EC2, Lambda layer for serverless functions. |
| Set propagation headers before signing | Adding headers after AWS Signature V4 signing invalidates the request signature and breaks traces. |
| Validate with a smoke test first | Confirm one trace in X-Ray Transaction Search and one metric in CloudWatch before expanding. |
| IT-Magic for production hardening | IT-Magic handles ADOT deployment, IAM scoping, VPC endpoints, and telemetry cost optimization at scale. |
Table of Contents
Running this on your own AWS setup? IT-Magic is an AWS Advanced Tier Partner — we audit, fix, or fully manage it for you.
Get a free consultation- What AWS components does OpenTelemetry on AWS actually use?
- How do you collect metrics, logs, and traces on AWS?
- Which deployment pattern fits your environment?
- How does Lambda auto-instrumentation work with OpenTelemetry?
- Where should you send each signal type?
- How do you handle context propagation across AWS services?
- Getting started: a minimal checklist and timeline
- When should you build in-house vs. hire an AWS partner?
- The part most guides skip
- IT-Magic brings OpenTelemetry on AWS to production
- Sources
- FAQ
What AWS components does OpenTelemetry on AWS actually use?
Each piece of the stack has a specific job. Knowing which service handles which signal saves you from wiring things together twice.
ADOT Collector is the engine. It is an AWS-supported distribution of the OpenTelemetry Collector that automatically collects AWS resource metadata (instance IDs, ECS task ARNs, EKS pod labels) and can forward telemetry to multiple AWS and partner monitoring solutions. That metadata correlation is what cuts mean time to resolution: you can tie a spike in application latency directly to the underlying EC2 instance or ECS task without writing a join query.

Amazon CloudWatch accepts all three signal types natively. Metrics are queryable with PromQL, logs land in Logs Insights and LiveTail with EMF support, and OTLP traces appear in Transaction Search for interactive span exploration. Cross-signal correlation works because all three share a common data model.
AWS X-Ray is the right trace destination when you need AWS-native service maps, sampling rules managed through the X-Ray console, or tight integration with API Gateway and Lambda. If your team already queries traces in X-Ray, keep sending there rather than migrating everything.
Amazon Managed Service for Prometheus (AMP) handles high-cardinality metrics and PromQL queries at scale. Use it when your metrics volume outgrows CloudWatch’s cost model or when your team already runs Grafana dashboards against a Prometheus-compatible endpoint.
CloudWatch agent as an OTLP bridge. The CloudWatch agent supports an otlp configuration section for metrics, logs (EMF), and traces. It is the right choice when you have existing agent deployments you do not want to replace, or when workloads cannot run a full sidecar.
OpenTelemetry SDKs and OTLP. AWS-supported SDKs exist for Java, Python, Go, Node.js, .NET, and Ruby. For Node.js, the @opentelemetry/instrumentation-aws-sdk package adds automatic instrumentation for AWS SDK v3 calls. OTLP standardizes the export format so the same SDK configuration works regardless of which backend you choose.
Pro Tip: Start with auto-instrumentation libraries before writing custom spans. They cover HTTP, database, and AWS SDK calls with zero code changes, giving you a useful signal baseline before you tune anything.
How do you collect metrics, logs, and traces on AWS?
Three ingestion paths cover most AWS workloads.
The primary path is instrumented applications sending OTLP directly to the ADOT Collector. Your app initializes the SDK, configures an OTLP exporter pointing at the Collector’s gRPC (port 4317) or HTTP (port 4318) endpoint, and the Collector handles batching, retry, and export routing. Data flow: SDK → Collector → exporter(s).
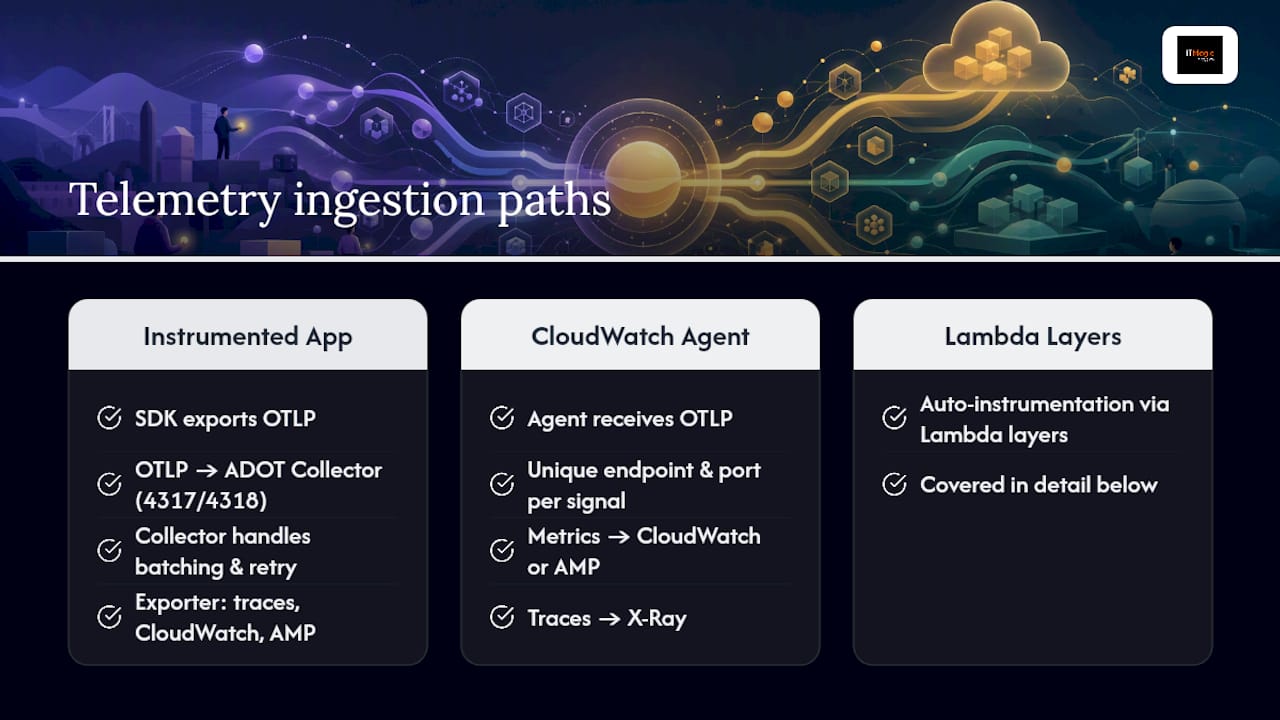
The second path uses the CloudWatch agent as the receiver. Configure an otlp section in the agent’s JSON config with a unique endpoint and port for each signal type. Metrics route to CloudWatch or AMP; traces route to X-Ray. This path suits EC2 fleets where the CloudWatch agent is already deployed and managed through Systems Manager.
The third path is Lambda auto-instrumentation via layers, covered in detail below.
A minimal Collector pipeline configuration describes three blocks: a receiver (otlp with gRPC and HTTP endpoints), a processor (batch to reduce API call frequency), and an exporter (awsxray for traces, awsemf for metrics/logs to CloudWatch, or prometheusremotewrite for AMP). Each signal type gets its own pipeline under the service.pipelines key.
Pro Tip: Each otlp section in the CloudWatch agent config requires its own unique endpoint and port. Reusing the same port across sections causes silent failures that are hard to diagnose.
Which deployment pattern fits your environment?
The ADOT Collector runs on Docker, ECS, EKS, and EC2, and the right pattern depends on your workload shape and how much operational overhead you can absorb.
Sidecar runs one Collector container per application pod or task. It gives you strong isolation and per-service configuration, but multiplies the number of Collector processes you manage. Best for ECS Fargate or EKS microservices where each service has distinct export requirements.
Daemon/service runs one Collector per node or as a shared ECS service. Lower overhead, easier to update, but a single misconfiguration affects all workloads on that node. Best for EC2-backed ECS clusters or EKS node pools with homogeneous instrumentation needs.
Host agent (CloudWatch agent) sits on the EC2 instance and bridges OTLP from local processes. Minimal deployment change for teams already running the CloudWatch agent fleet-wide.
Lambda layer is covered separately below. It is the only viable pattern for serverless functions.
Pro Tip: For high-throughput pipelines, add a memory_limiter processor before batch in your Collector config. Without it, a traffic spike can OOM-kill the Collector and drop telemetry silently.
How does Lambda auto-instrumentation work with OpenTelemetry?
Lambda instrumentation uses two separate layers: an instrumentation layer for your runtime and an optional Collector layer. The OpenTelemetry community Lambda auto-instrumentation docs walk through both.
- Add the instrumentation layer ARN for your runtime and region to the Lambda function configuration.
- Set the
AWS_LAMBDA_EXEC_WRAPPERenvironment variable to/opt/otel-handler(or the runtime-specific wrapper path). - Enable active tracing on the function (X-Ray tracing mode:
Active). - Decide on a Collector: the instrumentation layer does not bundle one. Either point the SDK exporter at an external ADOT Collector, or add the ADOT Collector Lambda layer as a second layer.
- Set
OPENTELEMETRY_COLLECTOR_CONFIG_FILEto point at your Collector config if using the Collector layer.
Layer ARNs are region-specific. Always use the ARN for the same AWS region as your Lambda function. A layer ARN from us-east-1 will not resolve in eu-west-1, and the function will fail to initialize.
Cold start overhead is real. Each instrumentation layer adds initialization time, and the Collector layer adds more. For latency-sensitive functions, benchmark cold starts with and without layers before committing to the Collector layer approach. An external Collector (sidecar or service) avoids the cold-start cost entirely.
Where should you send each signal type?
The right exporter depends on what you need to do with the data after it arrives.
CloudWatch’s native OpenTelemetry support makes it the default destination for teams that want a single pane of glass. Metrics land in CloudWatch Metrics (PromQL-queryable), logs go to Logs Insights, and traces appear in Transaction Search. The common data model lets you correlate a slow trace with the log line that explains it.
X-Ray is the better trace destination when you need AWS service maps, sampling rules, or integration with API Gateway. It does not handle metrics or logs, so most teams use it alongside CloudWatch rather than instead of it.
AMP is worth the extra setup when your metrics cardinality is high (thousands of label combinations) or when your team already runs Grafana. PromQL is more expressive than CloudWatch Metrics math for complex aggregations.
Third-party backends (Datadog, Grafana Cloud, New Relic) work through the ADOT Collector’s standard exporters. Running multiple exporters simultaneously is possible but doubles your data volume and cost. Use sampling aggressively when fanning out to more than two destinations.
How do you handle context propagation across AWS services?
AWS services natively support the X-Ray propagation format. The OpenTelemetry AWS compatibility guidance documents this clearly and flags two pitfalls that break distributed traces in practice.
The first pitfall is message services. SQS and SNS do not automatically forward trace context in message headers the way HTTP services do. To preserve context across an SNS-to-SQS-to-Lambda chain, inject the trace context into message attributes explicitly, then extract it in the consumer.
The second pitfall is request signing. AWS Signature Version 4 signs the exact set of headers present at signing time. Adding propagation headers after signing invalidates the signature. Set all propagation headers before the signing step.
Attribute limits matter for cost. Adding large
baggageortracestatevalues to every request increases the size of every signed payload and every stored span attribute. Keep propagated context minimal: a trace ID and span ID, not a full user session object.
- Use the
AWSX-Raypropagator when your traces must pass through AWS-managed services. - For SQS/SNS, inject context into message attributes and extract it in the consumer Lambda or ECS task.
- Never add propagation headers after request signing.
Pro Tip: If you need to carry additional correlation context (a request ID, a tenant ID) across service boundaries, use a dedicated message attribute or a custom HTTP header rather than stuffing it into baggage. Baggage propagates to every downstream service and every stored span.
Getting started: a minimal checklist and timeline
A small team can reach basic observability in roughly one to two weeks for a proof-of-concept.
- Pick your SDK for each service language and add the auto-instrumentation library.
- Configure the OTLP exporter in each SDK to point at your Collector endpoint (gRPC port 4317 or HTTP port 4318).
- Deploy the ADOT Collector using the pattern that fits your environment (sidecar for EKS/ECS Fargate, daemon for EC2).
- Configure Collector exporters:
awsxrayfor traces,awsemffor metrics/logs to CloudWatch,prometheusremotewritefor AMP if needed. - Set IAM permissions: the Collector’s task role or instance profile needs
xray:PutTraceSegments,cloudwatch:PutMetricData,logs:CreateLogGroup,logs:PutLogEvents, andaps:RemoteWritefor AMP. - Send a test span and a test metric from one instrumented service.
- Confirm the trace appears in X-Ray Transaction Search and the metric appears in CloudWatch Metrics or AMP.
- Expand instrumentation to remaining services once the pipeline is validated.
| Phase | Task | Estimated effort |
|---|---|---|
| Day 1–2 | SDK setup and OTLP config | 4–8 hours |
| Day 3–4 | ADOT Collector deployment and IAM | 4–8 hours |
| Day 5–7 | Exporter config and smoke tests | 4–6 hours |
| Week 2 | Expand to remaining services | Varies by count |
For the smoke test, use the AWS X-Ray console’s Transaction Search or the CloudWatch Metrics explorer. A single trace with correct service name and span attributes confirms the full pipeline is working.
When should you build in-house vs. hire an AWS partner?
For a single-service proof-of-concept, in-house is fine. The checklist above is achievable in a week with one engineer who has AWS experience.
The calculus changes when you add scale, compliance, or multi-account complexity.
- High-scale telemetry (millions of spans per minute) requires Collector sizing, memory limits, and sampling strategy that most teams get wrong the first time.
- Compliance requirements (PCI DSS, SOC2, HIPAA) add IAM boundary constraints, VPC endpoint requirements, and encryption-at-rest mandates that interact with the Collector configuration in non-obvious ways.
- Multi-account environments need cross-account IAM roles, centralized Collector fleets, and account-level cost attribution for telemetry spend.
- Limited internal staff means the PoC never gets hardened for production, and the team inherits an unmonitored monitoring system.
Building a PoC is straightforward. Building a production-grade, cost-efficient, compliant observability pipeline on AWS is an infrastructure project, not a configuration exercise.
IT-Magic has delivered observability infrastructure across 700+ AWS projects since 2010, including environments under PCI DSS, SOC2, and HIPAA. When the stakes are higher than a PoC, the cost of getting it wrong exceeds the cost of getting help.
The part most guides skip
Most OpenTelemetry on AWS guides stop at “deploy the Collector and configure exporters.” That is the easy part. The hard part is what happens six months later: telemetry costs have grown faster than the engineering team expected, the Collector is running without memory limits, and no one knows which services are actually generating the most span volume.
The conventional advice is to instrument everything. The better advice is to instrument one critical service end-to-end first, validate the pipeline, and measure the cost before expanding. CloudWatch and AMP both charge on ingestion volume. A misconfigured SDK that emits a span for every database row read will generate a bill that surprises everyone.
The second thing guides underestimate is propagation. Getting traces to appear in X-Ray is easy. Getting a trace to flow correctly from an API Gateway request through SQS into a Lambda consumer, with the correct parent-child span relationship, requires understanding the X-Ray propagation format, message attribute injection, and the order of operations around request signing. That is where most implementations break, and it is not obvious from the docs alone.
Start narrow, validate the full signal path including propagation, then scale out.
IT-Magic brings OpenTelemetry on AWS to production
Getting from a working PoC to a production-grade observability pipeline is where most teams stall. IT-Magic, an AWS Advanced Tier Services Partner, handles the full path: ADOT Collector deployment and hardening, IAM policy scoping, VPC endpoint configuration for private telemetry pipelines, and telemetry cost optimization to keep CloudWatch and AMP spend predictable as data volumes grow.
Services relevant to this guide:
- ADOT Collector deployment across ECS, EKS, EC2, and Lambda
- Managed Collector fleet with memory limits, sampling, and alerting
- IAM and VPC configuration for compliant telemetry pipelines
- Telemetry cost sizing and ongoing cost optimization
Ready to move from PoC to production? Talk to IT-Magic’s AWS team about scoping your observability implementation.
Sources
- OpenTelemetry on CloudWatch (Amazon CloudWatch documentation)
- AWS Distro for OpenTelemetry (ADOT)
- Lambda auto-instrumentation (OpenTelemetry community docs)
FAQ
What is the ADOT Collector and why use it instead of upstream OpenTelemetry Collector?
ADOT is an AWS-supported distribution of the OpenTelemetry Collector that automatically collects AWS resource metadata and includes pre-built exporters for CloudWatch, X-Ray, and AMP. It reduces configuration overhead compared to building a custom upstream Collector for AWS environments.
Can the CloudWatch agent replace the ADOT Collector?
The CloudWatch agent can receive OTLP signals and route them to CloudWatch, AMP, and X-Ray, making it a viable bridge for existing agent deployments. For new deployments or complex pipelines, ADOT Collector offers more flexibility and AWS-native exporter support.
Do Lambda instrumentation layers include the OpenTelemetry Collector?
No. Instrumentation layers handle SDK initialization for your runtime, but you must separately provide a Collector, either as a second Lambda layer or as an external ADOT Collector. Layer ARNs are region-specific and must match your function’s AWS region.
How do you preserve trace context across SQS and SNS?
Inject the trace context into message attributes before publishing to SNS or SQS, then extract it in the consumer. AWS-managed services do not forward HTTP propagation headers automatically, so context must travel in the message payload itself.
What IAM permissions does the ADOT Collector need on AWS?
At minimum: xray:PutTraceSegments for traces, cloudwatch:PutMetricData and logs:PutLogEvents for metrics and logs, and aps:RemoteWrite for AMP. Scope these to the task role or instance profile of the host running the Collector.
Recommended
- AWS DevOps explained: accelerate delivery and scale securely
- The CTO’s guide to securing AWS infrastructure for scale
- AWS cloud operations tutorial: optimize and scale smart
- Build a robust DevOps automation workflow in AWS
Alexander founded IT-Magic, an AWS Advanced Tier Services Partner delivering DevOps, cloud architecture, and managed services since 2010. He holds:
- AWS Certified Solutions Architect – Professional
- AWS Certified DevOps Engineer – Professional
- AWS Certified Security – Specialty
- AWS Certified Advanced Networking – Specialty
Talk to a certified AWS team trusted by INTERTOP, Foxtrot, Pandora, and J.Hilburn.
Get a free consultation