The online world keeps changing. New businesses launch every day, and established brands fight for attention in a crowded market. In this environment, traffic can surge for many reasons, from seasonal promotions to viral social media posts. If a site can’t handle these boosts in visitors, the result could be slow load times, frustrated users, or even server crashes. That’s why leaders need to grasp website performance metrics. Even if you’re not a developer, you can still learn the basics and guide your team toward success.
These metrics are more than numbers. They describe how well your page responds to user actions, how swiftly data moves from servers to browsers, and how stable the experience stays under stress. A website’s efficiency is key to user satisfaction. When people have a smooth experience, they stay longer and convert more often. But if load times spike or pages fail to render, you risk losing both credibility and sales. Keep reading to explore each vital metric, why it matters, and how you can make informed decisions that boost business growth.
What are website performance metrics?
Website performance metrics—also called page performance metrics or webmetrics performance—offer a structured way to measure how a site performs under real-world conditions. Think of them as a detailed health report. They reveal how quickly the page loads, whether images appear in time, how many data requests are involved, and more. These metrics to measure website performance are not just for hardcore tech teams. Non-technical leaders, especially those focused on results, can benefit from understanding them too.
Below are a few ways they help:
- Guiding priorities: By looking at these key metrics for website performance, you can see which areas need attention first. If the page size is huge, for instance, focus on compressing images or trimming unneeded scripts.
- Spotting trends: Over time, these numbers show if you’re improving or regressing. Are you cutting down load times each month, or creeping upward?
- Shaping user experience: A fast site delights people. They can find content and products without delay. But a slow site drives them away, affecting your ability to generate leads and sales.
When you improve metrics for website performance, you usually see side benefits. Search engines like fast, stable sites, which can help your search rankings. Engaged visitors often spend more time exploring, boosting brand loyalty. And a site that handles heavier traffic without glitches is primed for growth.
Why it is important to measure website performance
Proper measurement of website performance metrics informs decisions that help you stay competitive. It also offers these major advantages:
- Better user satisfaction: People hate waiting. If your pages appear fast, users tend to trust your brand more.
- Lower bounce rates: A slow site drives visitors to leave early. Detailed metrics show you exactly what’s slowing you down.
- Higher conversions: Fast load times lead to more completed actions, from newsletter signups to purchases. Speed matters because it helps keep potential customers engaged.
- Improved brand image: A quick, robust website suggests an efficient company. That’s true for any industry, whether you sell physical goods or provide services.
On the other hand, ignoring site performance metrics or letting them slip can damage a company’s reputation. If traffic spikes and your site crashes, you lose business. If user data loads slowly, frustration takes over. When frustration rises, so does the chance of losing that user for good. Measuring performance helps you find trouble spots before they become expensive problems.
Basic website performance metrics
Let’s dive into the core metrics one by one. Each reveals a different angle on how your site behaves. This section shows you where to pay attention and offers clues for improvement. Reading them in sequence gives you a foundation that makes everything else easier to understand.
Page load time
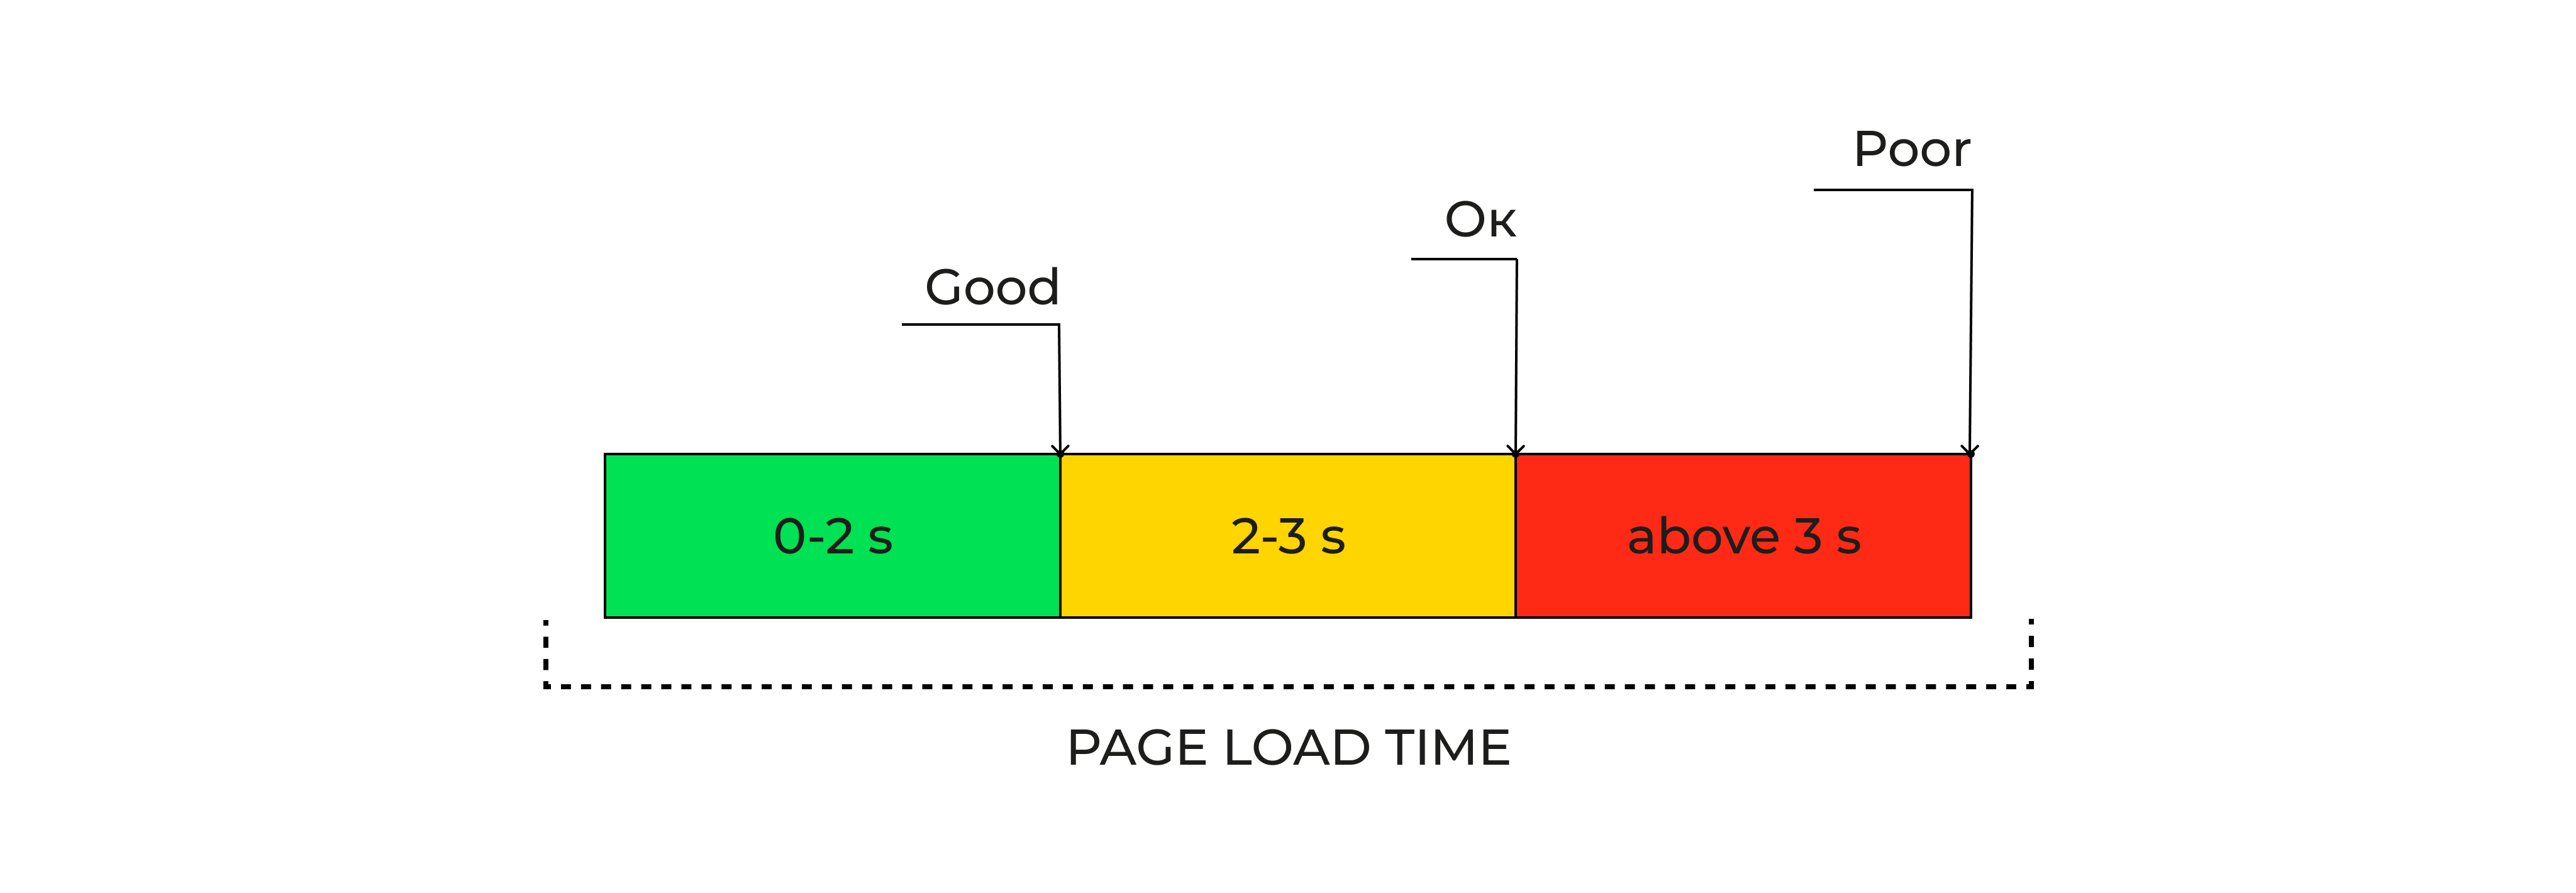
Page load time is the span from when someone clicks a link or enters a URL until the webpage finishes loading. All elements—images, text, ads, scripts—should be visible and usable during that period. If you have a slow load time, you risk discouraging eager visitors.
What it is and why it’s important
Users form opinions in seconds. A site that appears snappy makes them think you’re organized and professional. A site that lags does the opposite. Slow pages hurt conversion, search rankings, and user satisfaction. Studies from sources like Google’s mobile insights show that even a brief delay leads to higher abandonment rates. Quick load times can mean an edge in a competitive niche. They also reflect well on your entire brand, from marketing to customer support.
One example: Suppose a user wants to buy a limited-edition product from your online store. They tap “Add to Cart” only to face a sluggish load. If it takes too long, they might quit and shop elsewhere. By tracking website performance metrics, you can identify if large images, poorly optimized code, or heavy plugins are the cause. Once you fix the issue, your load times drop, and your conversion rate can climb.
_______________________________________________________________________
Looking for expert help with website performance?
Explore cooperation with a seasoned AWS partner who can guide you through key steps for stable performance that grows with your user base.
_______________________________________________________________________
Time to First Byte (TTFB)
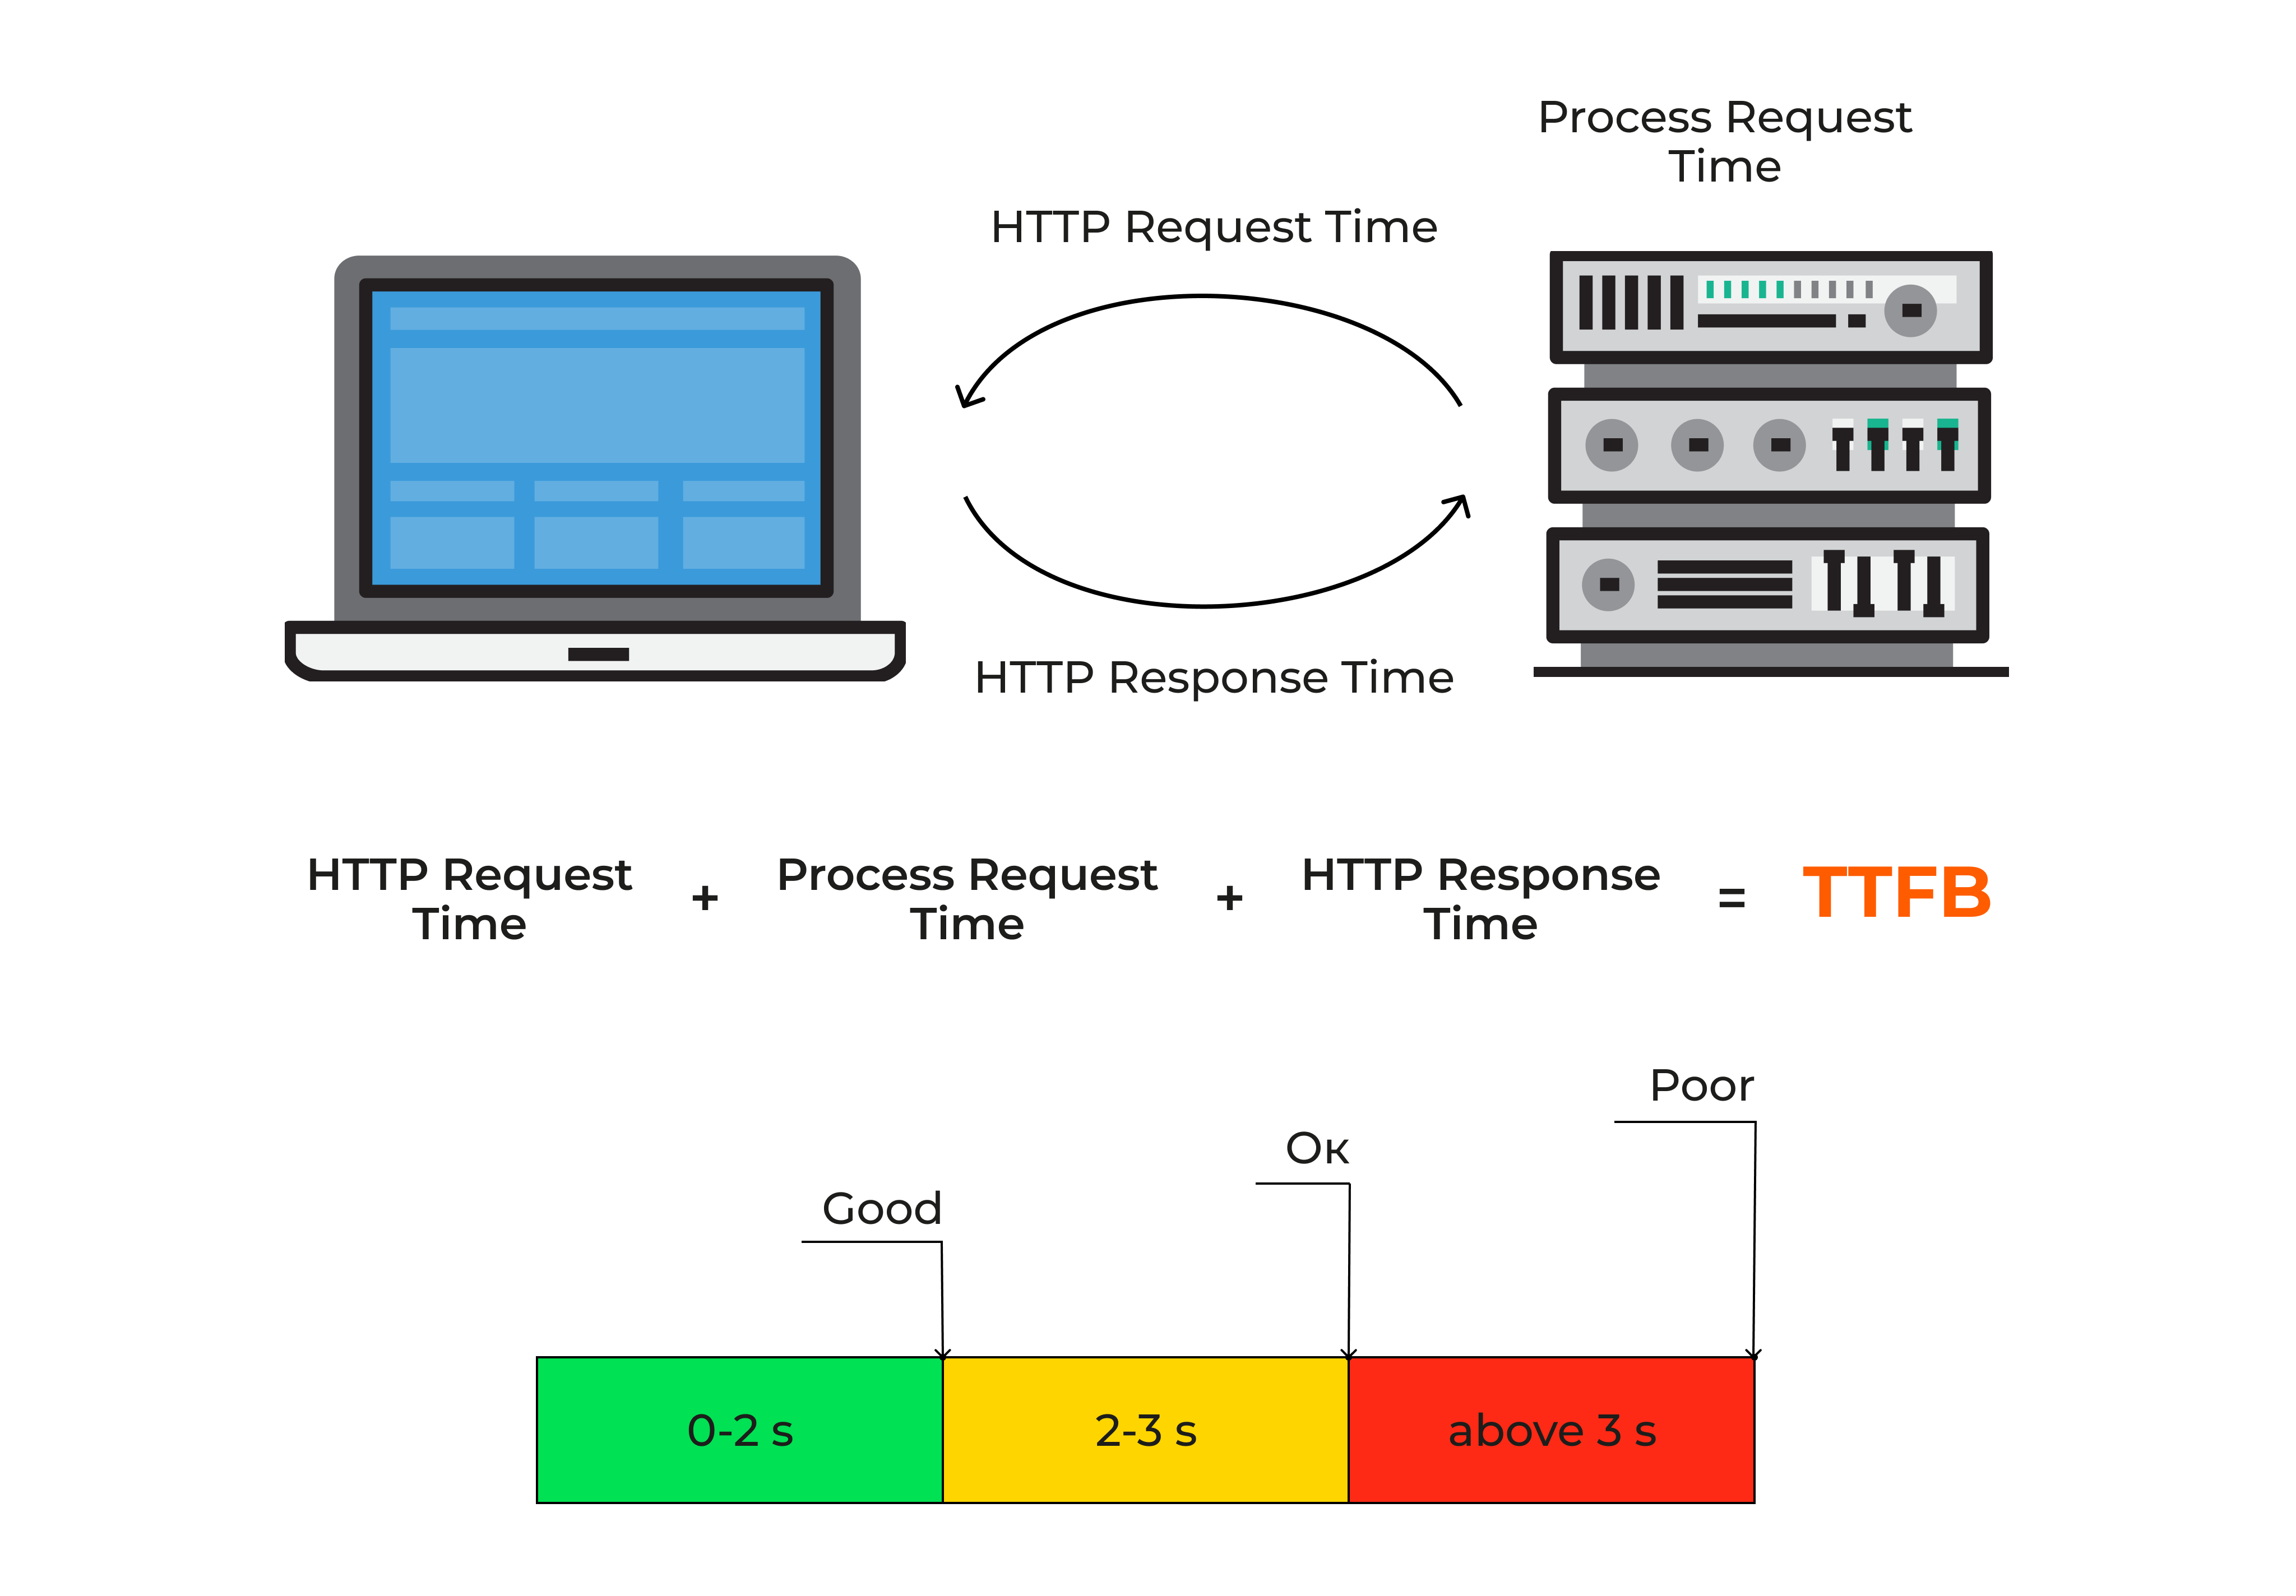
TTFB measures how long it takes the server to deliver the first byte of data to a user’s browser. In short, it’s the waiting period before a page even starts loading. A low TTFB means your backend responds fast. A high TTFB suggests server delays.
How this metric affects speed and user experience
If your TTFB is high, people see a white screen or a half-loaded page for too long. That alone can shape their view of your brand. They might blame the entire site for being slow, even if the rest of the page content loads decently afterward. By measuring TTFB, you can tell if you need to optimize your hosting setup, pick a better data center location, or reduce server-side processing. A good TTFB keeps visitors engaged and sets the stage for a smooth session.
It can be useful to compare TTFB (server response) and overall load time side by side. TTFB might be quick, but total load time still drags if you have big scripts or images. Conversely, you can have a decent load time even if TTFB is subpar, if you use clever lazy-loading or caching. To see the complete picture, track both.
By cross-referencing different metrics, you uncover root causes. That ensures you invest resources in the right solutions.
Number of requests
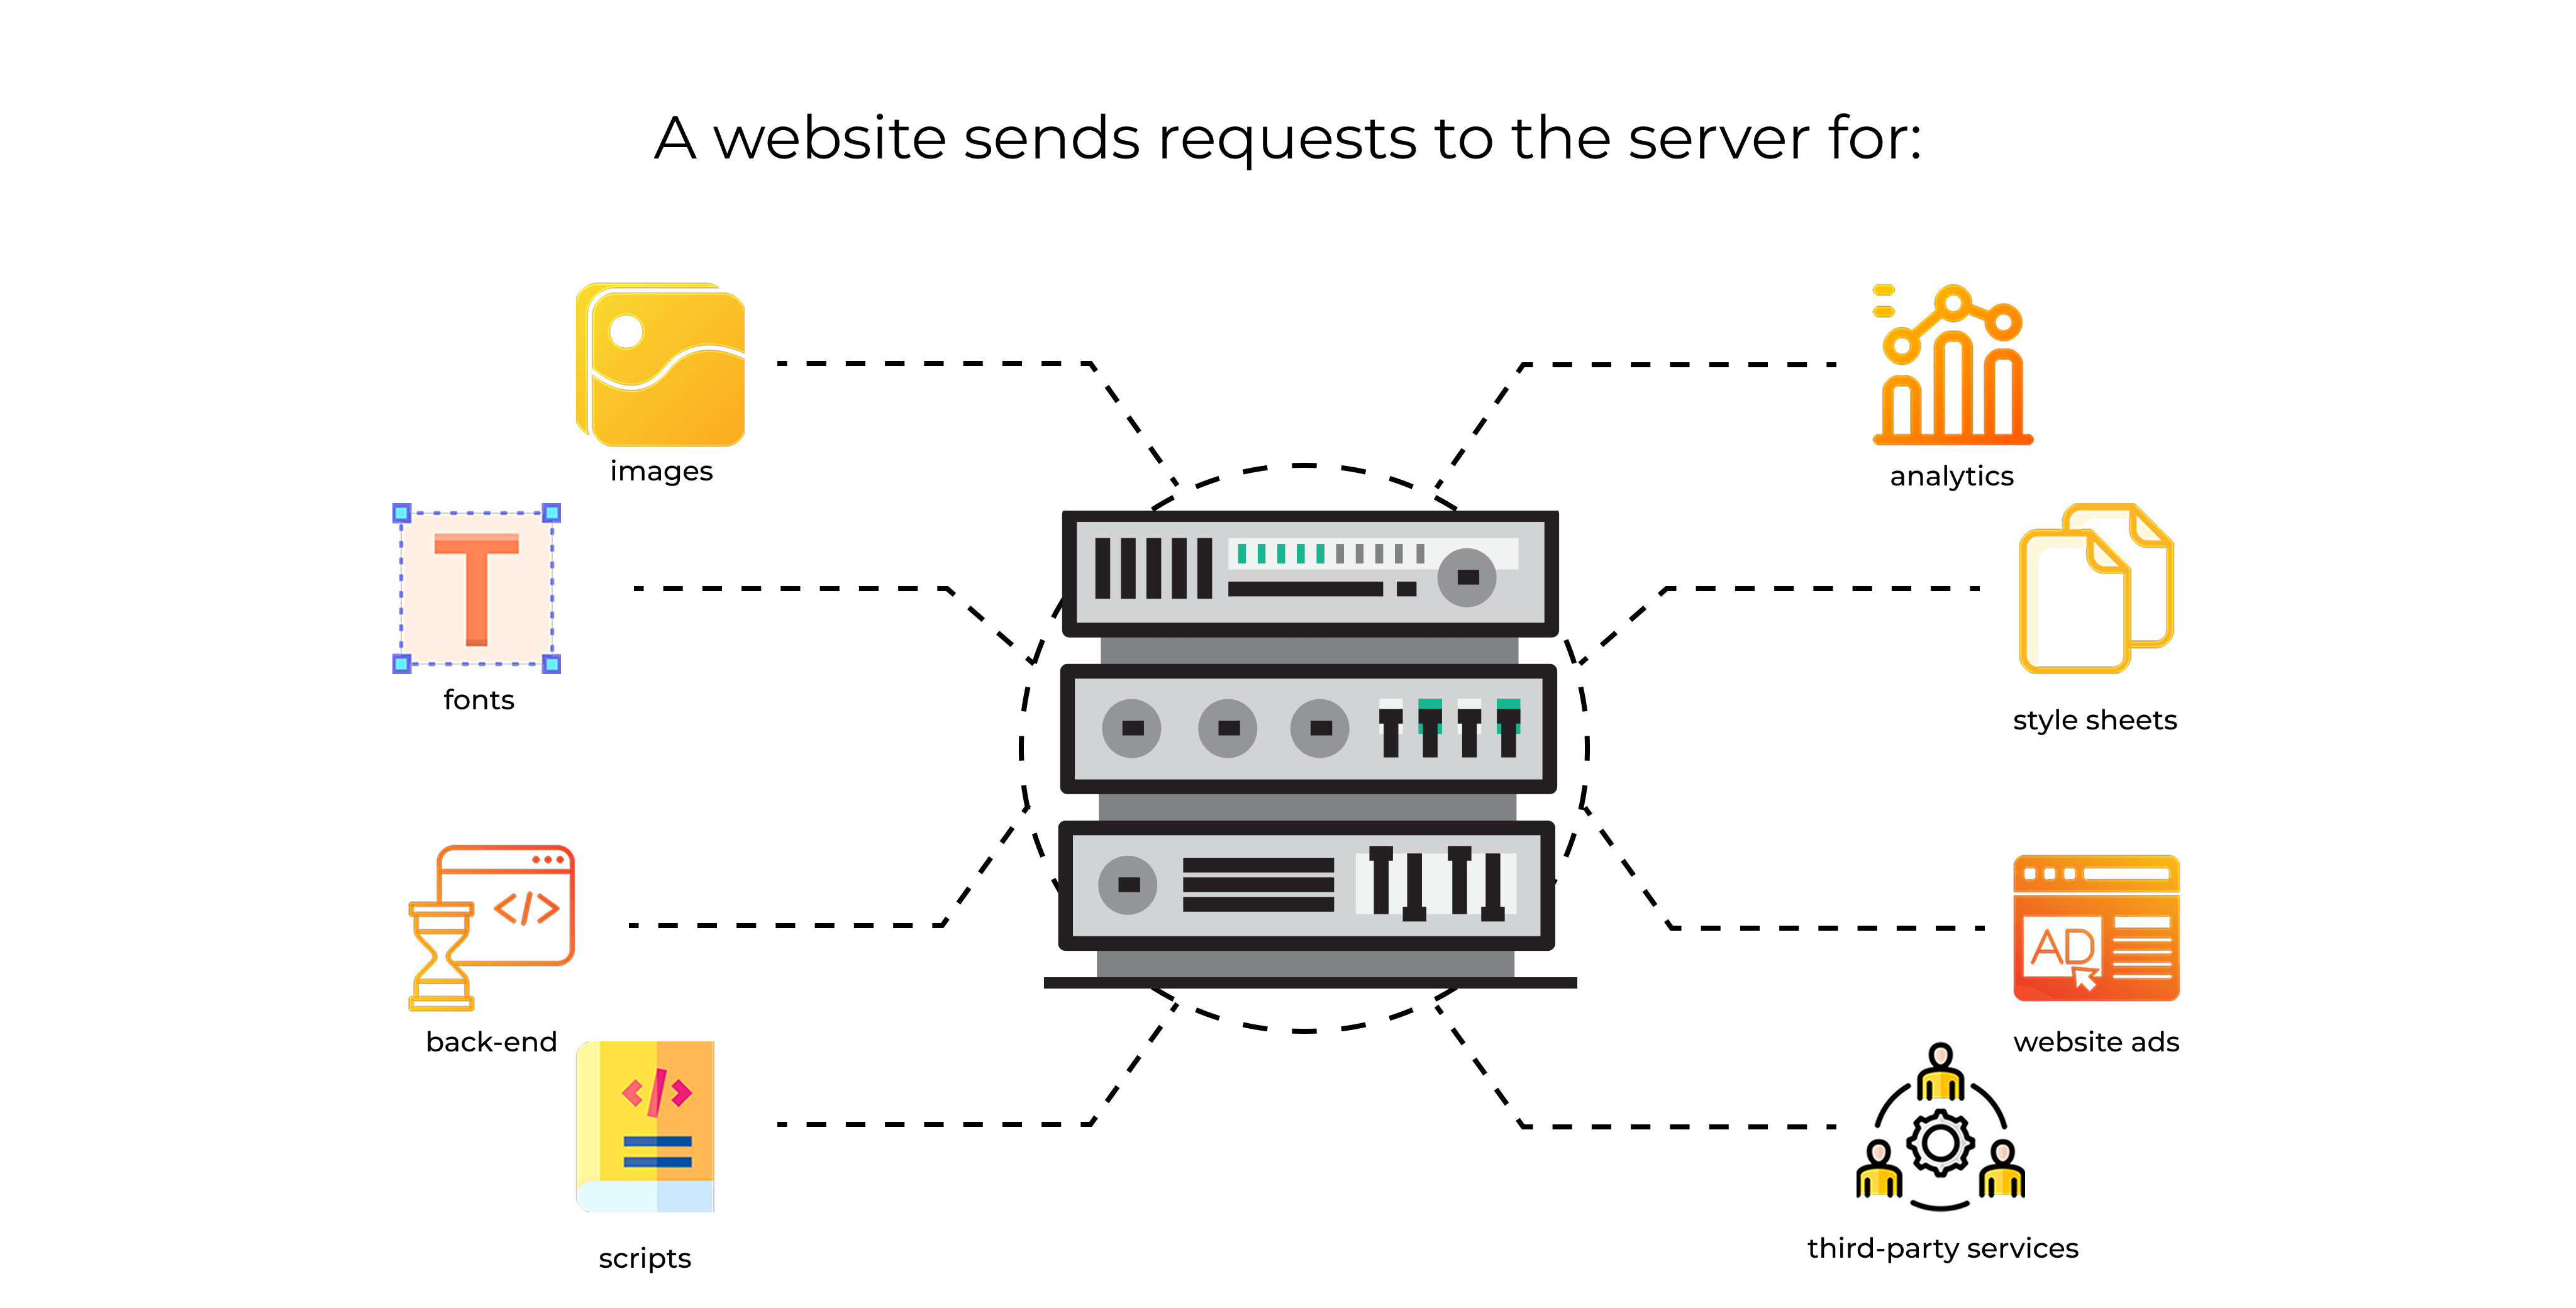
Each page may include various images, style sheets, scripts, and fonts. When a browser fetches these resources, it sends individual requests to the server. The total number of these requests can be large. If you aren’t careful, you may have hundreds of them.
What this means and how reducing the number of requests affects performance
When a site makes excessive calls to the server, you face more overhead. The browser waits for each file. This can slow the page to a crawl. By merging CSS files, compressing scripts, and optimizing image delivery, you reduce these calls and speed up load times. Properly managing these requests boosts performance and helps keep visitors from leaving out of frustration. Think of it like a busy restaurant. If each drink, appetizer, and napkin requires a separate trip, service bogs down. But if staff deliver items in efficient groupings, the pace picks up.
Page size

Page size is how much data (in kilobytes or megabytes) your page loads. Many resources, such as large images or embedded videos, increase the overall size.
Why it’s important to keep an eye on page size
Overly large pages slow the load time. On slower internet connections, that’s a deal-breaker. Even on faster connections, huge pages sap user patience, especially on mobile. A smaller page usually leads to better performance. This means images are compressed, scripts are minified, and multimedia elements are managed wisely. The payoff is quicker rendering, less wasted user data, and better search signals because search engines pay attention to speed and efficiency.
Mobile optimization
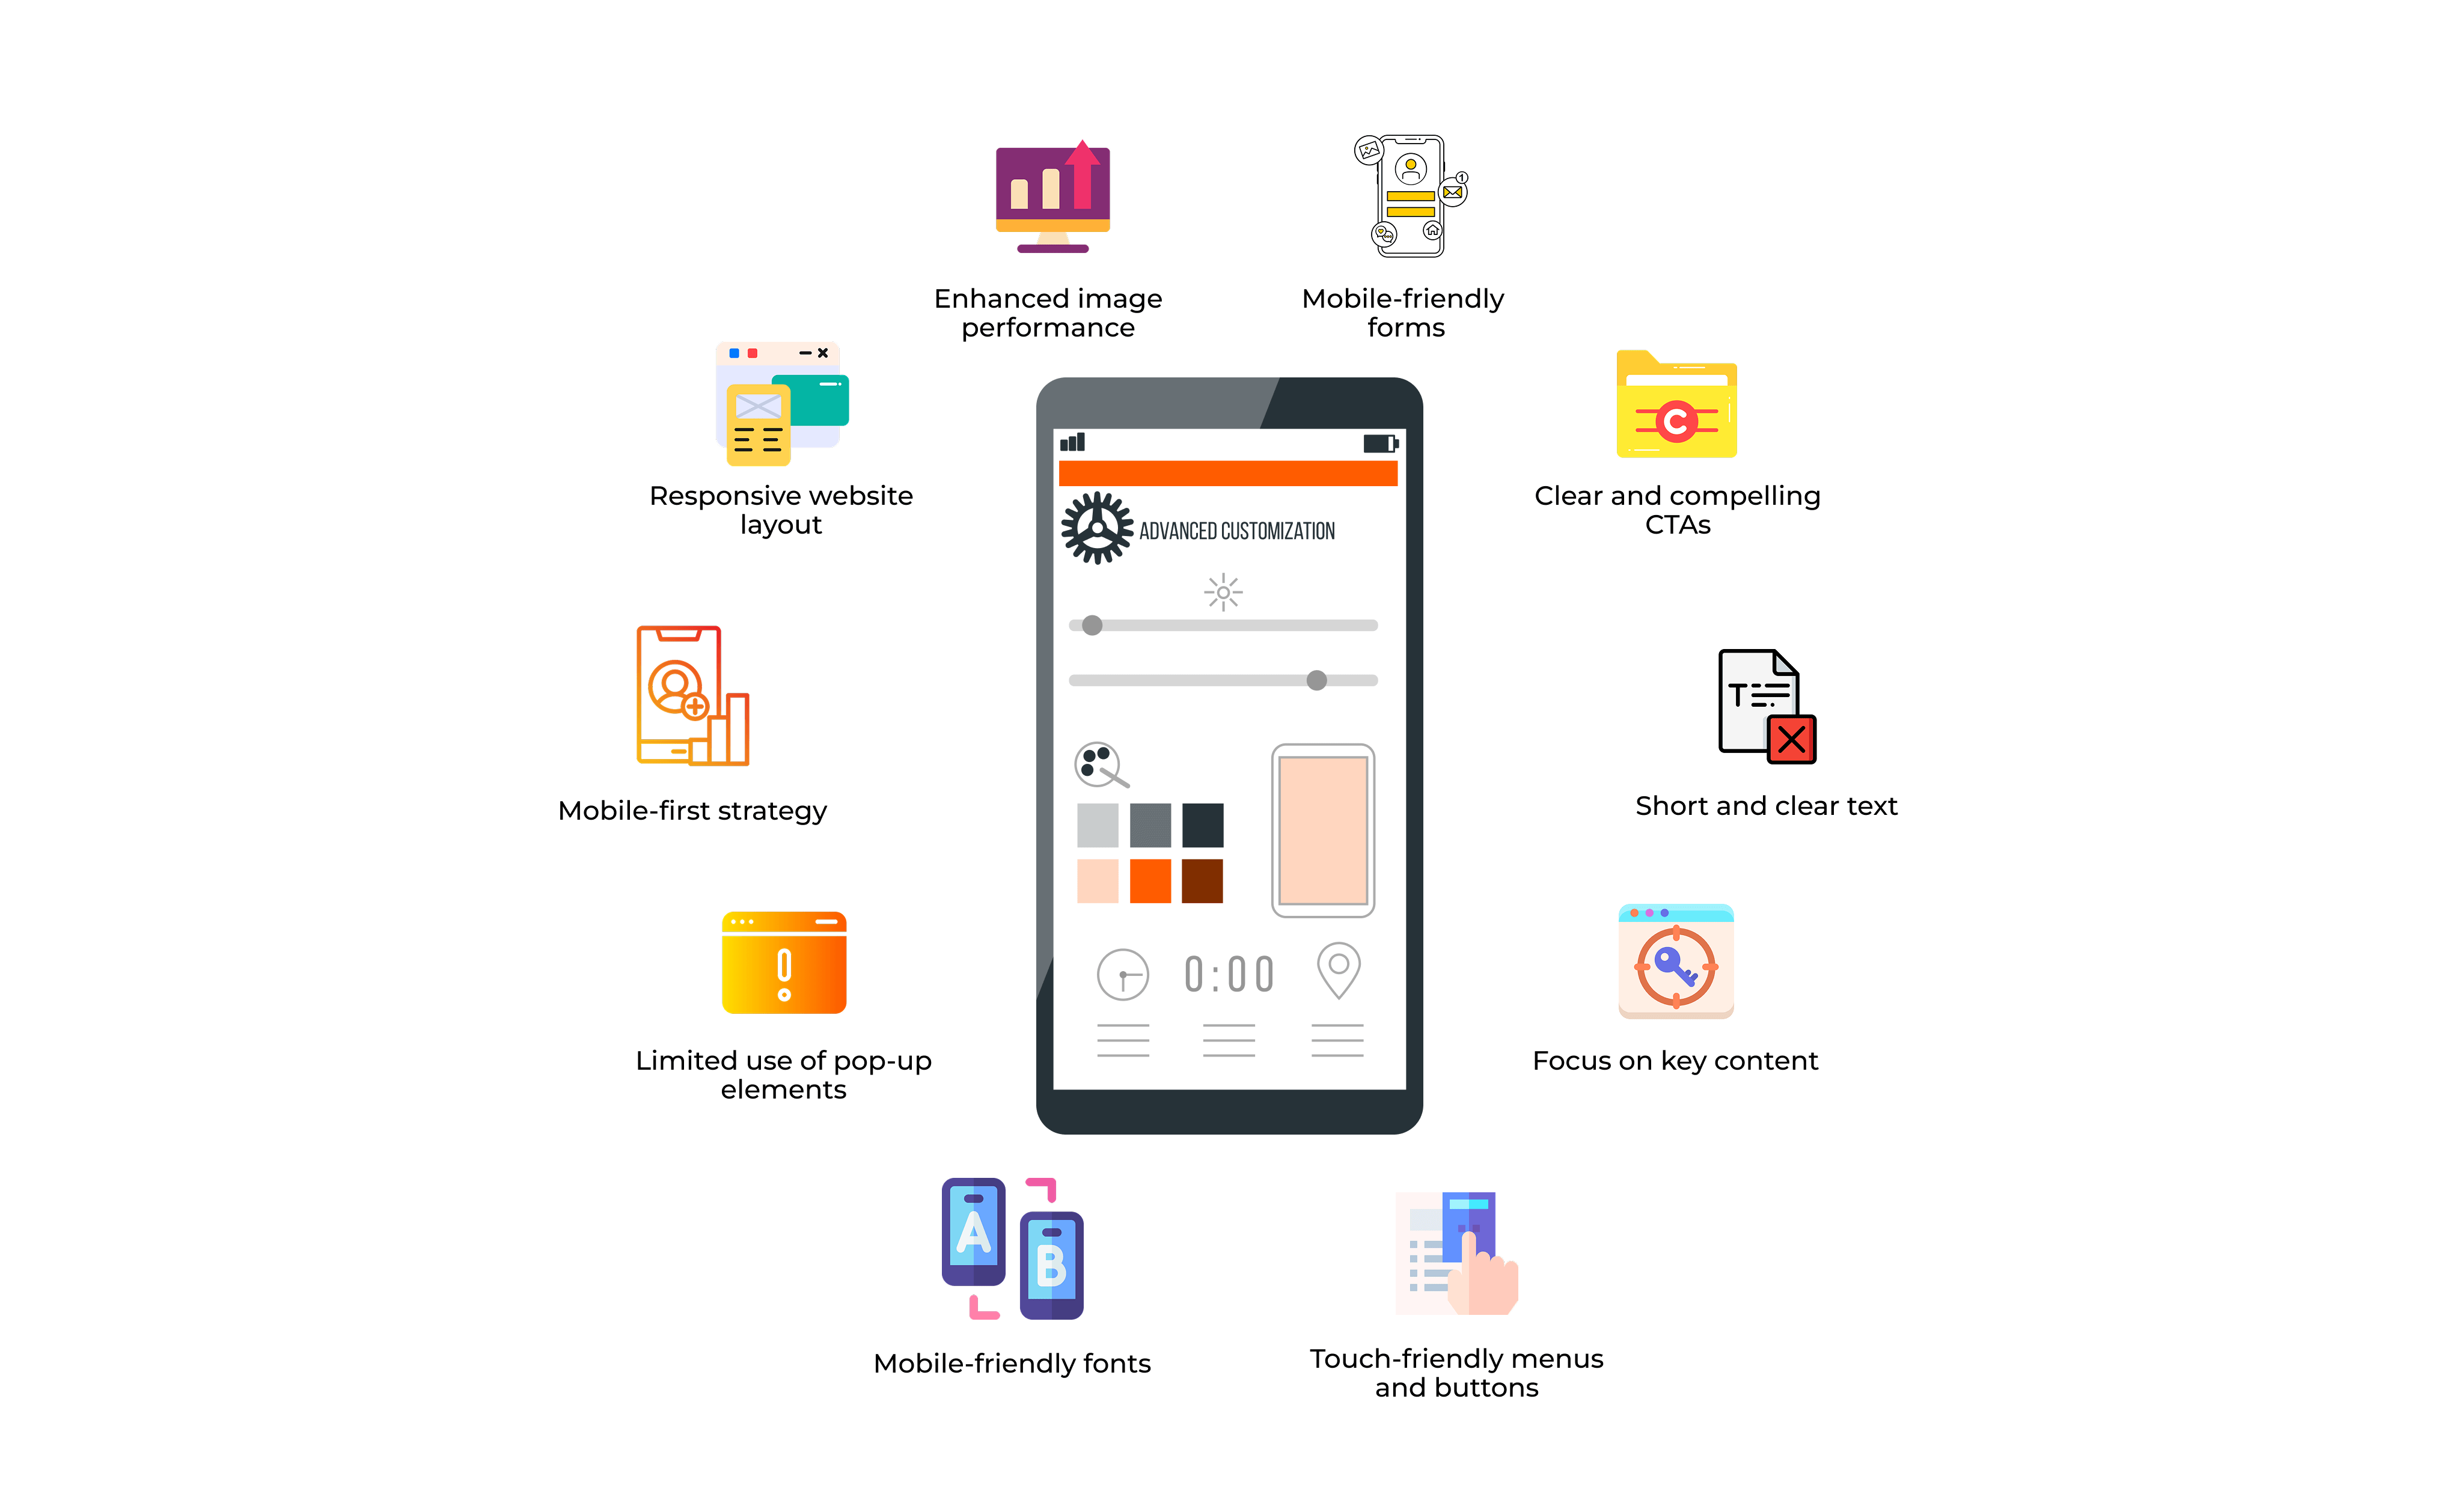
Every year, more people browse on smartphones or tablets. That shift means your site must perform well on small screens and varying network speeds. Mobile optimization ensures the site is easy to navigate, loads fast, and looks good on a handheld device.
The impact of mobile performance on overall site performance
Google moved to mobile-first indexing. That means it ranks and indexes the mobile version of your site before the desktop version. If your mobile pages lag, you might drop in search results. Also, many visits now come from phones. Fail to optimize them, and you’ll lose a huge audience. Quick pages and a clean layout encourage more organic traffic and more conversions. This includes making sure buttons are big enough to tap, text is readable without zooming, and images scale to fit smaller screens.
Average session duration
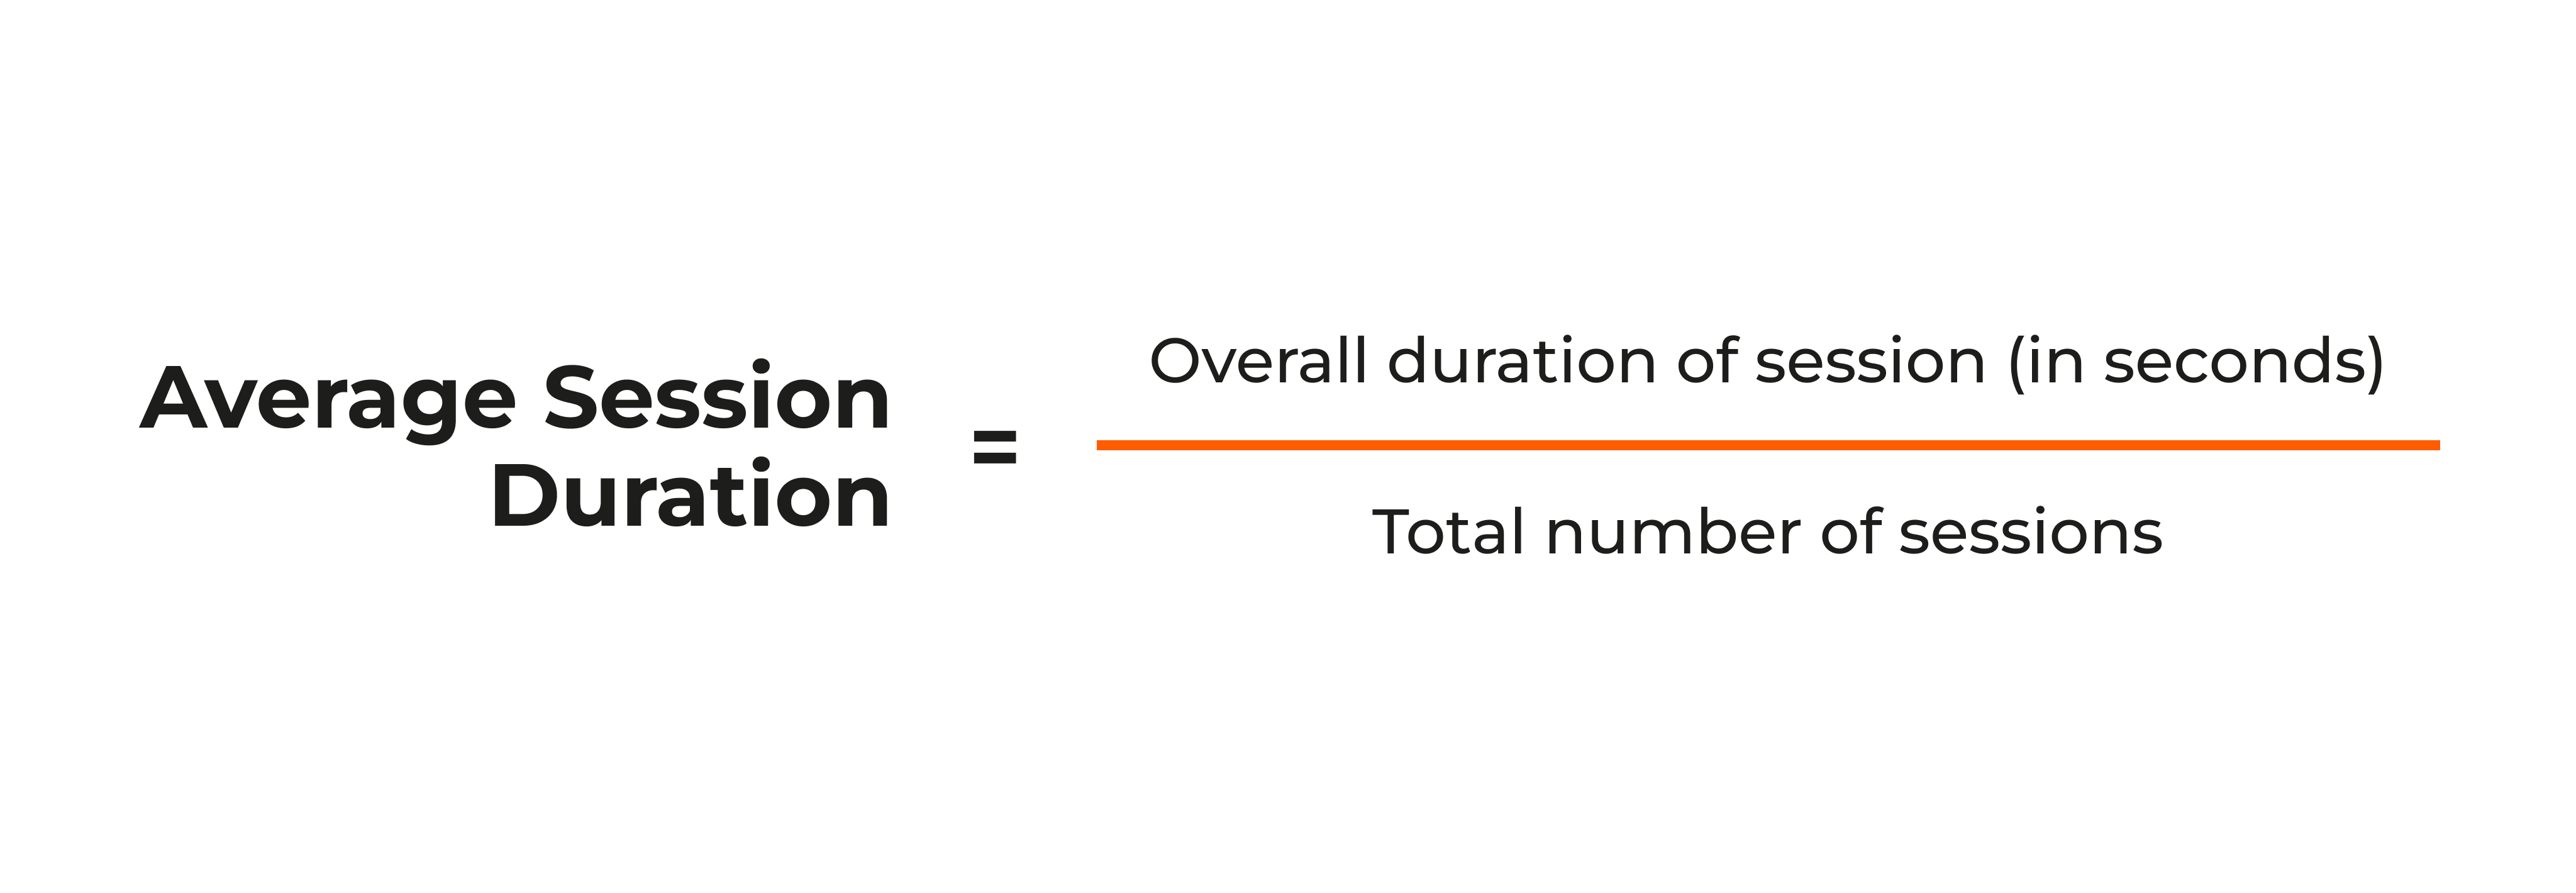
Sometimes people open a site for two seconds and leave. Other times, they stay for minutes or hours. Average session duration tracks how long, on average, users remain active on your site.
Impact on user engagement and behavior
If people don’t stay long, your content might be off-target or your site might be slow. A decent session duration often means engaging pages, good design, and relevant information. When visitors stick around, they’re more likely to sign up, purchase, or share your content. This metric also helps gauge how well your storytelling or product pages hold attention. If you see your site’s session duration plummet, it might be time to investigate broken links, slow performance, or unappealing design.
Server response time
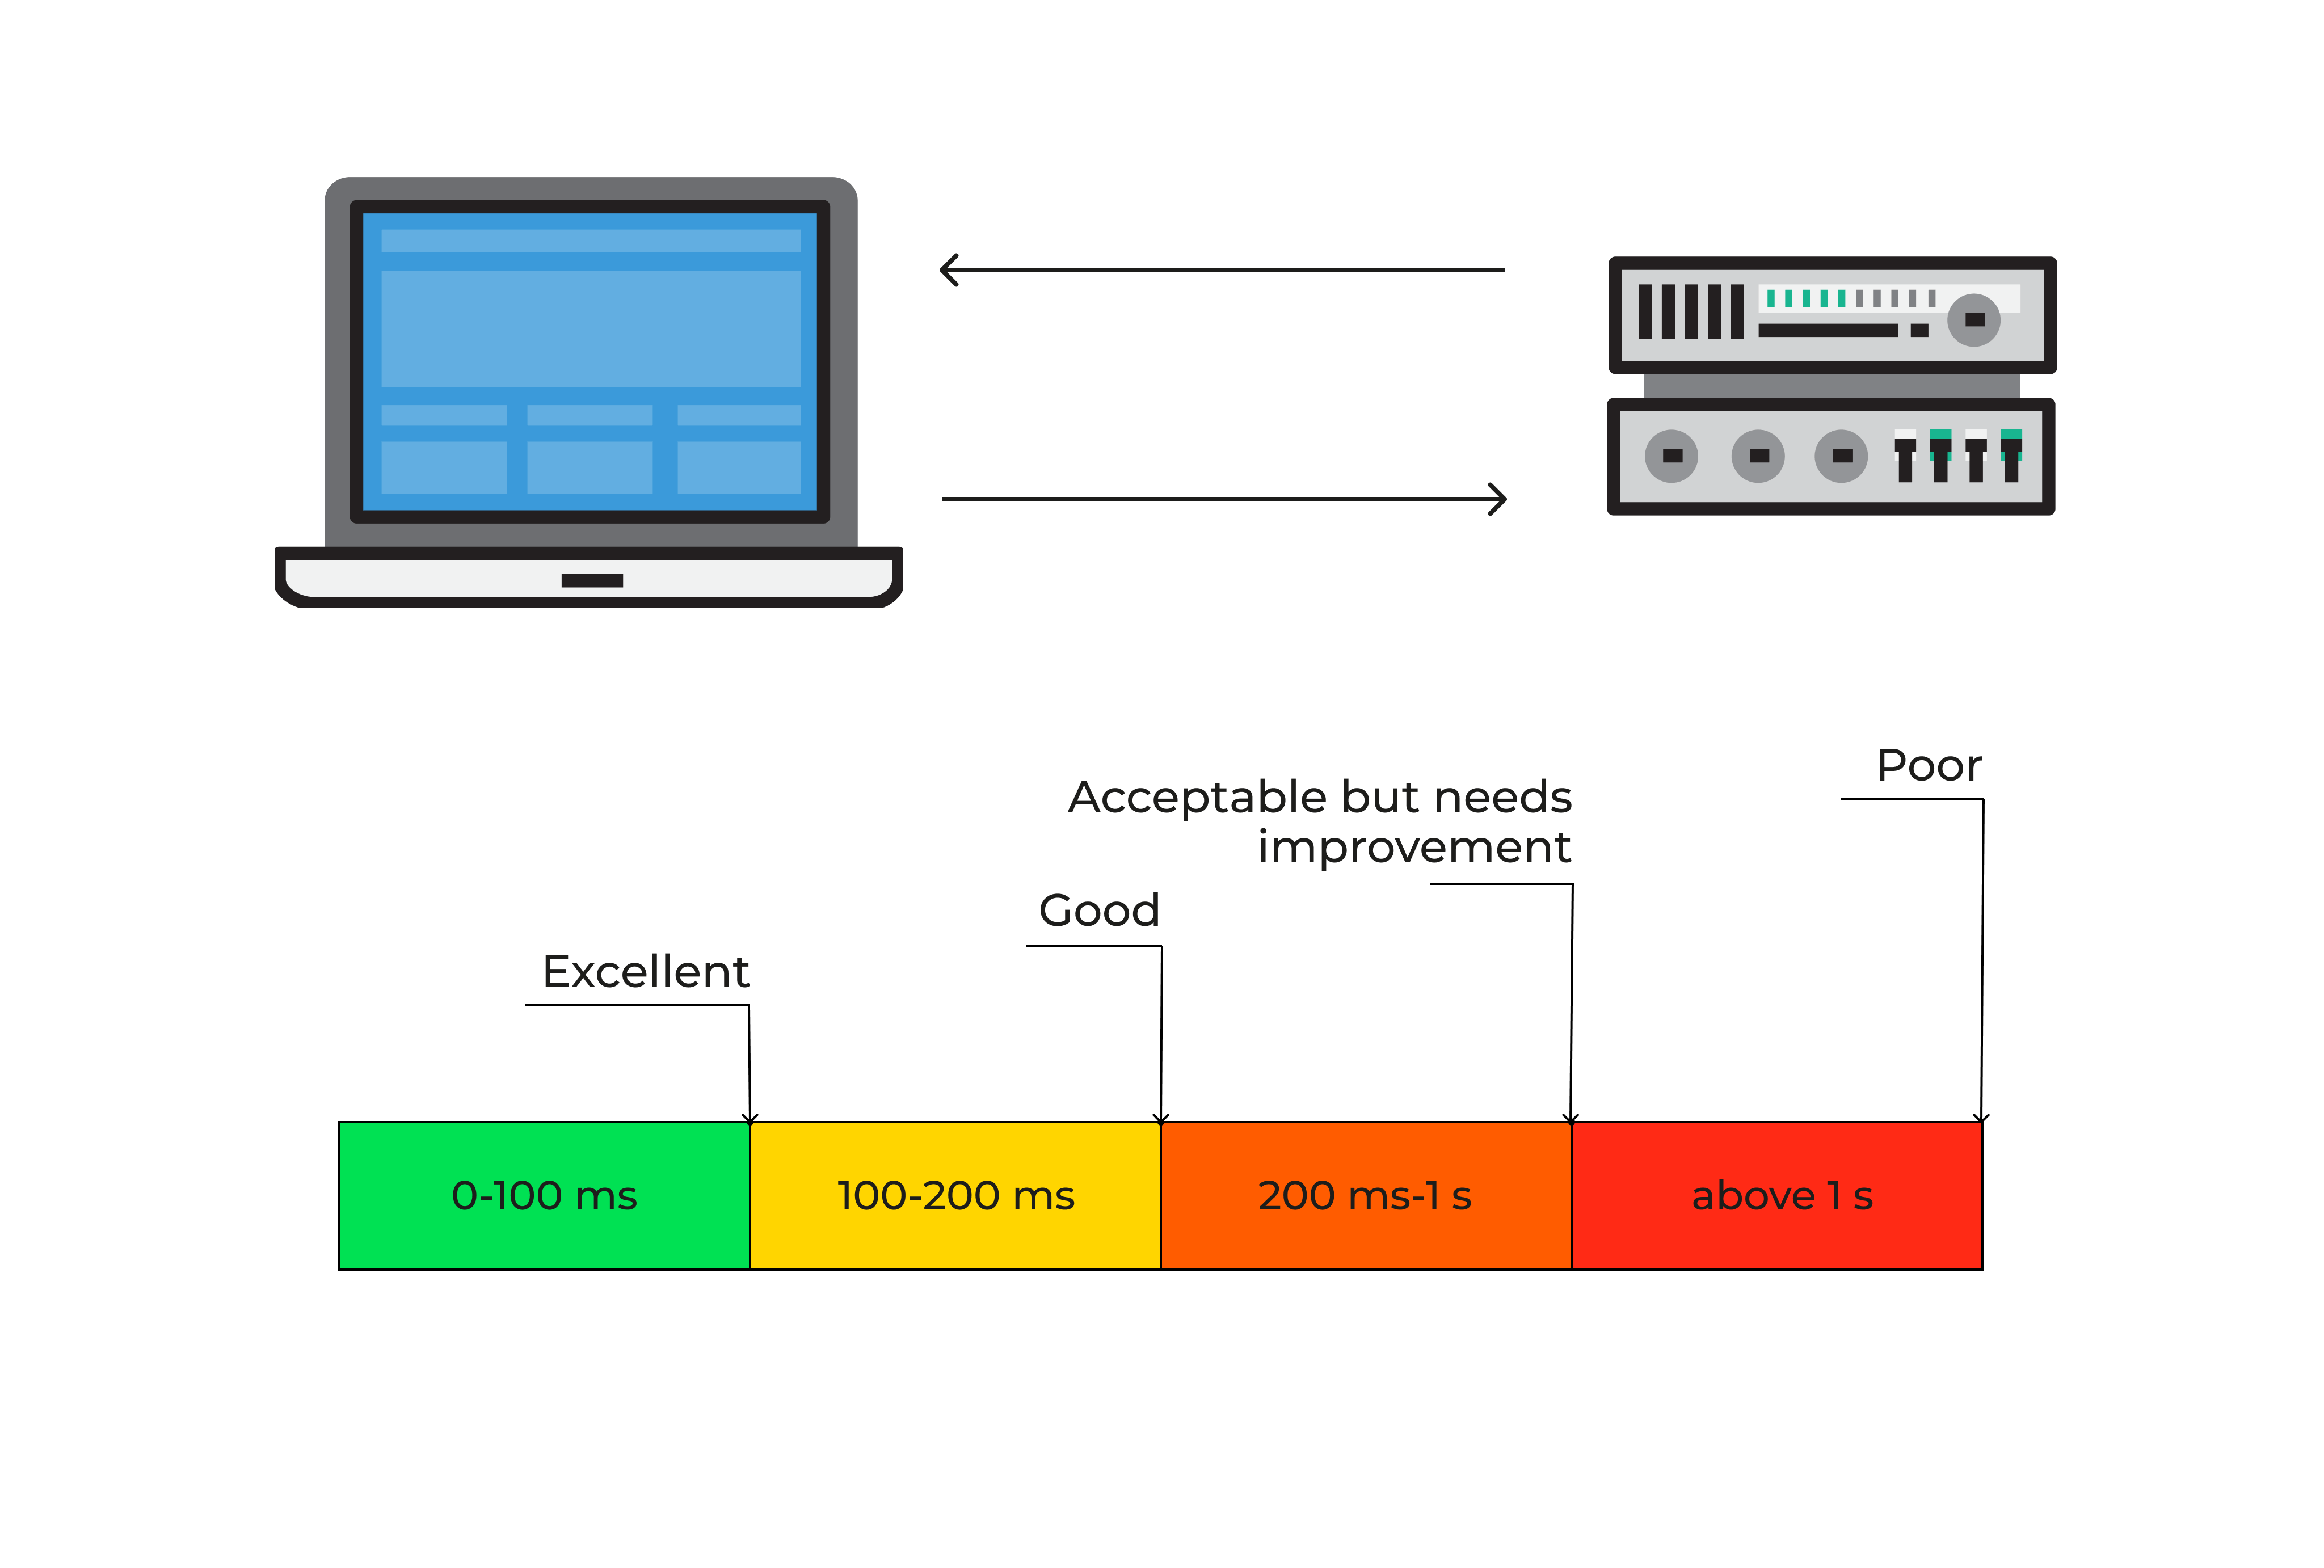
Server response time is the lag between a request hitting the server and the server’s response. It’s related to TTFB but involves more factors, like database queries or server-side scripts.
How server response speed affects user perception of a website
People blame slow pages on the site owner, not on hidden processes. If the server is bogged down, they won’t care if it’s a coding glitch or an overloaded database. They’ll just leave. A quick server fosters trust and can dramatically boost search visibility. If your site is hosted on an underpowered or misconfigured server, no front-end optimization will fix deep bottlenecks. Checking server response times helps you gauge if your hosting solution is robust enough to handle your traffic and keep your brand image intact.
Take a look at сommon hosting setups and their pros and cons:
| Hosting Type | Pros | Cons |
| Shared hosting | Affordable, easy to set up | Server resources shared with other sites, can slow down |
| Virtual Private Server (VPS) | More control, dedicated resources | Requires technical knowledge, higher cost than shared |
| Dedicated server | Full control, highest resource allocation | Expensive, you manage everything |
| Cloud hosting (AWS, Azure) | Scales with traffic, pay for usage | Complexity can be high, cost scales with usage |
Selecting the right hosting influences TTFB, server response time, and overall reliability. If your site experiences random spikes in traffic, a scalable cloud solution can keep you online without manual intervention. That fosters a smoother user journey and safeguards your brand’s image during peak periods.
Conversion rate

Conversion rate is the fraction of visitors who complete a desired action. This might be buying a product, signing up for a newsletter, or requesting a quote. If your site logs 1,000 visits a day and 50 of those visits result in a purchase, your conversion rate is 5%.
How conversion rate helps to evaluate the effectiveness of a website
It ties directly to revenue and leads. If your conversion rate spikes after you improve load times, you’ll know your performance tweaks are working. It’s also a vital barometer for user satisfaction. People convert more often when they trust the site, find it easy to use, and get answers fast. Slow speeds undermine that trust. Monitoring this metric helps you measure ROI on performance improvements.
Error rates
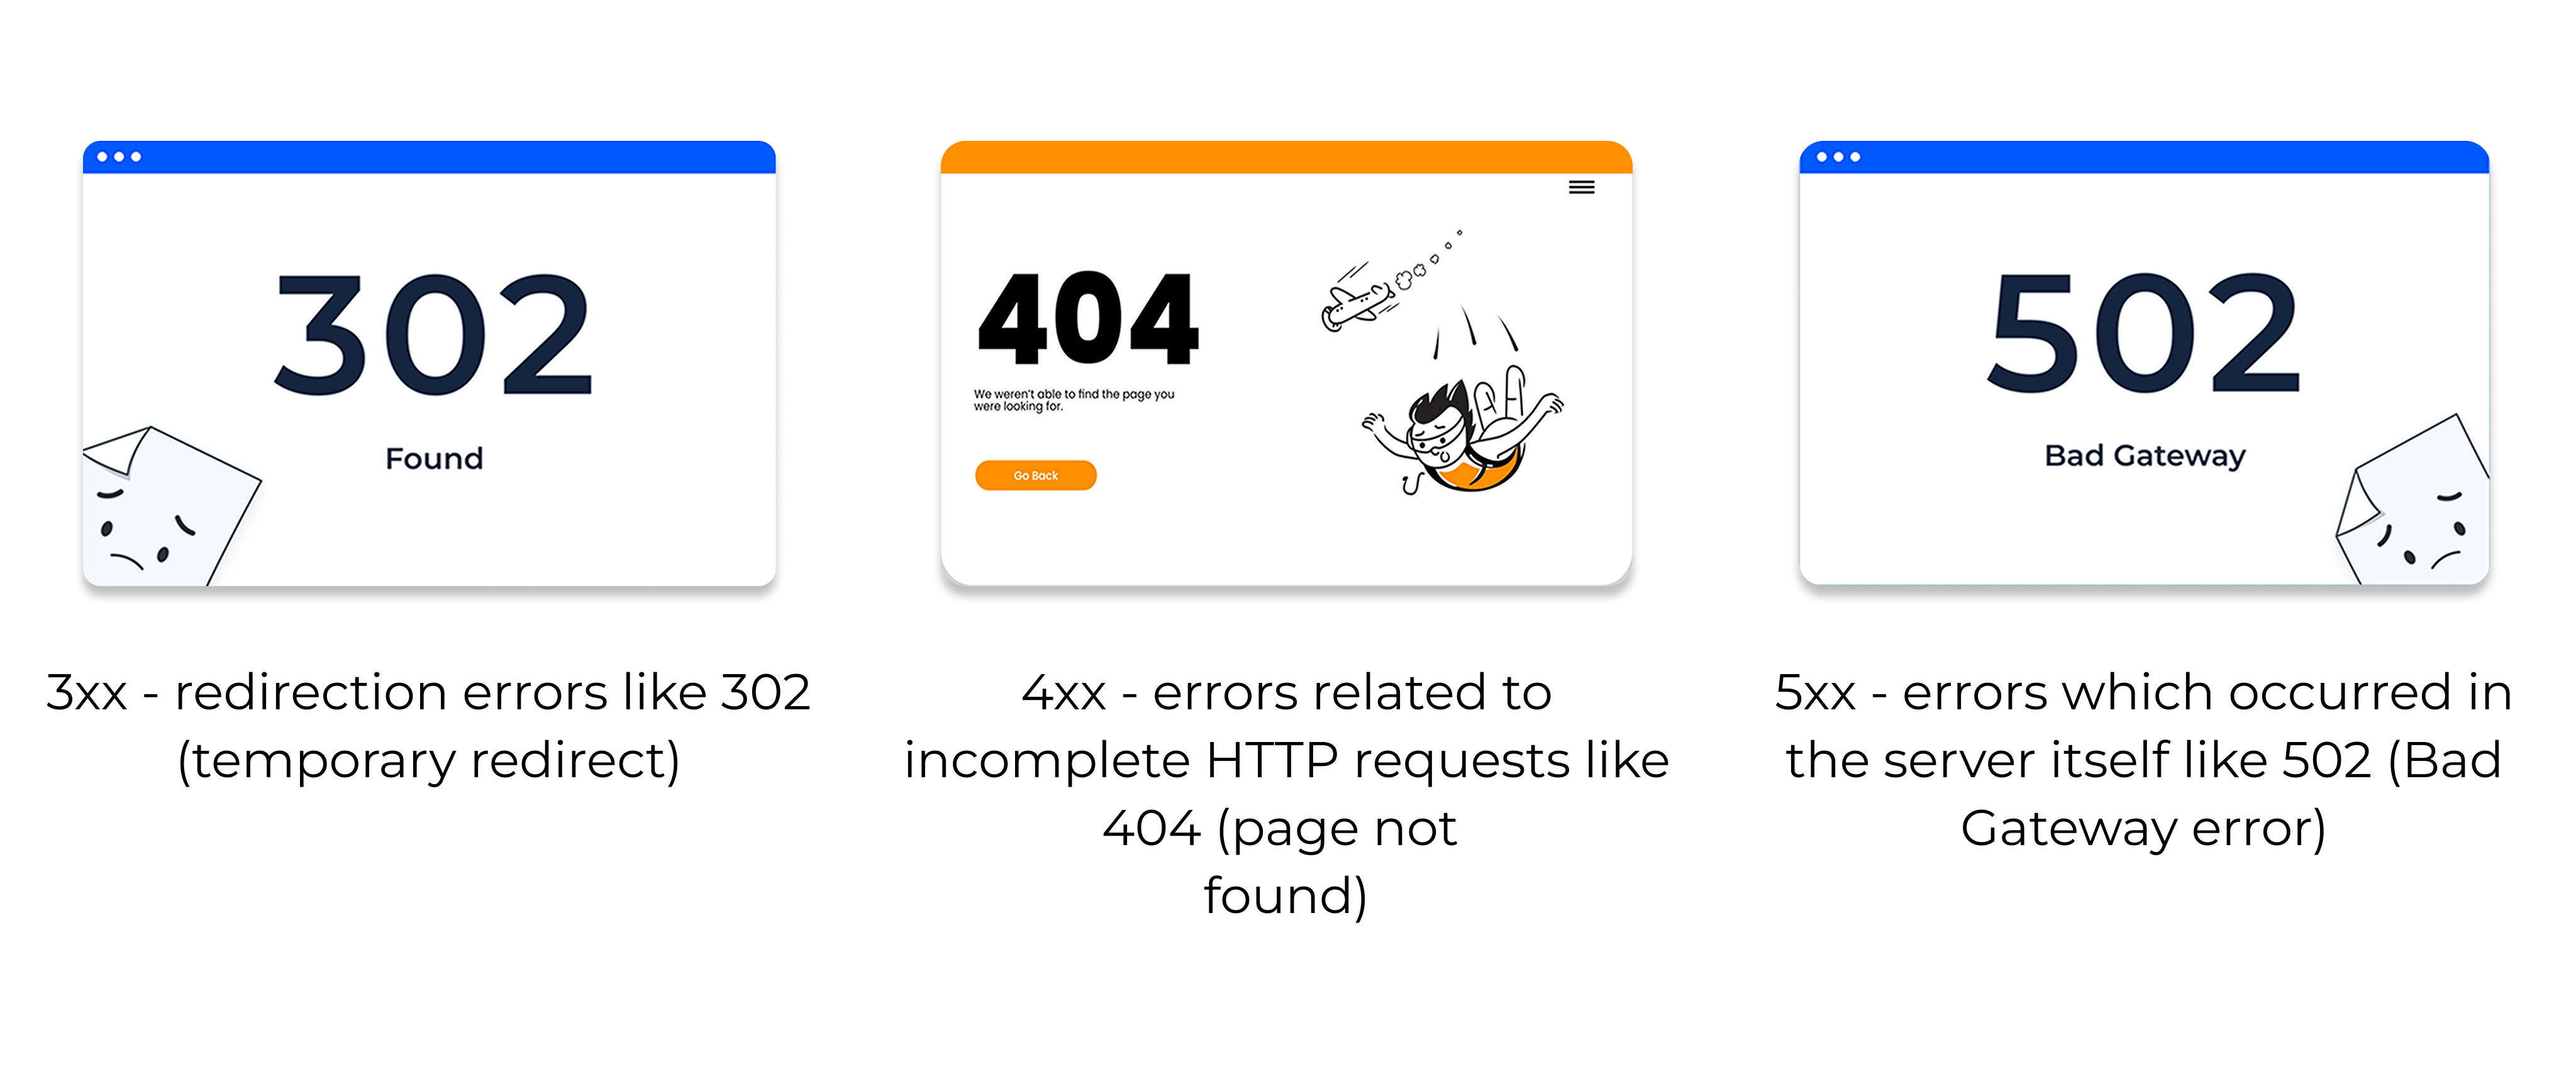
Error rates measure how often your site shows unexpected issues, such as 404 pages or server timeouts. These errors can frustrate users and affect your search ranking.
How website errors can reduce user trust
Broken pages suggest a lack of care or outdated maintenance. If a buyer hits a 404 when trying to view a product, you might lose that sale forever. High error rates can also push your site down in Google results, reducing organic traffic. Fixing these errors promptly shows a commitment to quality. Over time, fewer errors mean smoother navigation, higher trust, and better retention.
How metrics affect business
Website performance isn’t just about speed. It’s about outcomes. Each metric connects to revenue, brand perception, and the user’s willingness to return. A slow or glitchy site repels new visitors and frustrates regulars.
How poor performance can affect conversions, sales, and brand reputation
Imagine a global sale event. You see a surge in traffic from excited shoppers. But your site can’t handle the load. They encounter timeouts or heavy lag. Many give up. You lose immediate sales and future referrals. Word-of-mouth spreads that your platform is unreliable. Over time, you pay in lost reputation. Good website performance metrics are like an insurance plan against these catastrophes.
Case studies confirm this. When online retailers improve load times by a single second, they often see a measurable jump in revenue. That’s because every second counts. If you want your business to flourish in a crowded market, you can’t neglect performance. It’s the backbone of your digital presence.
Tools for monitoring website performance
Grading your site might sound daunting, but it doesn’t have to be. Several free and paid tool options let you track web page performance metrics with ease.
An overview of available tools (e.g., Google PageSpeed Insights, GTmetrix)
- Google PageSpeed Insights: A free service from Google that scores mobile and desktop speeds. It shows you problem areas, from large images to unused CSS.
- GTmetrix: Provides a deep dive into resource usage, load time waterfalls, and performance scores.
- Pingdom: Checks speed from different global servers and gives detailed breakdowns of file sizes and load orders.
- WebPageTest: Offers advanced testing, including multi-step transactions, to see how your site behaves in real user journeys.
These tools highlight your performance in color-coded results. They also suggest easy fixes. If your page fails a metric, you’ll see a note, such as “Compress images” or “Minify CSS.” Reviewing these tips helps you set clear priorities.
How to use these tools to analyze performance
- Enter your URL: Go to the tool’s site and type in your webpage address.
- Check scores: A single test often yields overall ratings or “grades.” But don’t rely on one grade alone. Explore the detailed breakdown.
- Study recommendations: Tools might point out big image files or uncompressed scripts. Tackle the biggest offenders first.
- Compare tests: Different tools highlight different data. Cross-reference them for a fuller view.
- Monitor over time: Re-test every few weeks or after major updates. This helps you see if changes have improved your performance.
How to improve site performance: practical tips
Tweaking web performance metrics doesn’t require a complete site rebuild. Simple changes often have major effects. Below are actionable steps anyone can try.
Image optimization
Images often take up most of a page’s weight. However, striking the right balance is key. Beautiful visuals attract attention, but if they’re huge or unoptimized, they can kill speed. A well-structured site can look great without sacrificing speed.
By optimizing images, you can make things load faster.
- Compression: Use tools like TinyPNG or Compressor.io to shrink file sizes without losing quality.
- Choose proper formats: JPEG for detailed photos, PNG for graphics with sharp lines, WebP for advanced compression if your users’ browsers support it.
- Responsive loading: Serve images sized for the user’s device. A big desktop image on a mobile screen wastes data and time. Consider using background colors or gradients instead of giant hero images when possible.
Minimize code (CSS, JavaScript)
Bulky code slows downloads. Here’s how to streamline it:
- Combine files: Fewer external files mean fewer server calls.
- Minify: Remove extra spaces, comments, or lines in CSS and JS. Tools like UglifyJS or CSSNano do this automatically.
- Load async or defer: Place scripts so they don’t block the rest of the page from loading.
Using CDN to speed up loading
A Content Delivery Network, or CDN, hosts your static files on servers spread around the world. Here’s why that helps:
- Shorter distances: Visitors download from the nearest server, speeding delivery.
- Load balancing: If one server faces a surge in traffic, the network shifts requests to others.
- Global reach: Ideal if your users come from diverse regions, so everyone gets a similar experience.
Recommendations for improving the mobile version
Mobile sites need different strategies than desktop sites. Try these tips:
- Responsive design: Auto-adjust layouts for different screen sizes.
- Streamlined media: Offer smaller image versions for mobile. Huge files can frustrate phone users with limited data.
- Simplified navigation: Make menus short, with large taps for fingers.
- Caching: Browsers can store some parts of your site so it loads faster next time.
Below is a chart that sums up common issues with key website performance metrics, their causes, and how to fix them:
| Issue | Cause | Quick Fix |
| Slow load times | Large images, uncompressed scripts, poor hosting | Compress images, minify code, upgrade hosting |
| High TTFB | Underpowered server, poor database queries, or excessive overhead | Optimize server, consider region-based hosting |
| Too many requests | Many CSS/JS files, multiple analytics scripts, or ads | Combine files, remove unneeded scripts |
| Large page size | HD images, embedded media, bloated design | Resize or compress images, remove heavy elements |
| Error rates | Broken links, server overload, outdated plugins | Fix links, update plugins, scale hosting |
| Low conversion rate | Confusing layout, poor speed, lack of trust signals | Simplify design, boost speed, add reviews or testimonials |
| High mobile bounce | Unreadable layout on small screens, slow connections | Use responsive design, compress content, test on real devices |
Keep this table handy as a reference. When you see a spike in issues, match it to one of these causes, then apply the recommended remedy. Even partial fixes can lead to big gains in user satisfaction.
Conclusion
Optimizing website performance metrics starts with understanding them. You don’t need a deep technical background to see that speed, reliability, and user engagement are all connected. By watching these metrics to measure website performance, you can spot bottlenecks, fix slowdowns, and maintain a site that meets modern user expectations. Each small improvement adds up, boosting conversion, loyalty, and your standing in search results.
When you invest in web performance metrics, you also invest in your company’s future. Over time, these efforts build trust, encourage repeat visits, and help you grow. Use the tools we discussed to track your site’s health and apply the tips to keep load times in check. If you need specialized help setting up robust, scalable systems, a reliable partner can make all the difference.
Ready to strengthen your site’s foundation and ensure top-notch performance?
Transform your site into a fast, user-friendly platform that promotes business growth. Get the right consultation and expertise from cloud professionals with 15 years of experience.
FAQ
Can poor website performance impact business results?
Slow load times and unreliable service drive people away. Higher bounce rates translate to fewer leads and fewer sales. If people leave before exploring your site, they never discover your offers. Small lags might seem trivial, but research suggests each second of delay can cut conversion rates. Long-term, a shaky site also harms loyalty. If someone sees your pages fail, they might not return. Maintaining strong performance keeps visitors engaged, grows your user base, and boosts revenue.
Website performance also affects your rankings in Google. Search providers aim to give the best results. If your site loads slowly, search engines assume users might have a poor experience. A fast site signals a good user experience, which aligns with how Google decides to rank pages.
How can I improve my website’s performance without technical knowledge?
You don’t need to be a programmer. Many tool solutions cater to site owners with minimal coding skills. For instance, WordPress plugins like WP Rocket or W3 Total Cache handle caching and file compression with a few clicks. Platforms like Squarespace or Wix have built-in performance features. Also, you can run analytics checks in Google PageSpeed Insights or GTmetrix. These show you step-by-step tips: compress images, turn on caching, or reduce plugin bloat. Focus on removing anything that doesn’t serve a real function. That alone can work wonders for site speed.
What should I do if my website has high error rates?
Some 404s can be normal, like when you remove old content. Frequent 404s or 500s suggest deeper issues. They could mean you’re losing potential visitors and damaging your content’s link structure.
Check for broken internal links or moved pages without proper redirects. One more reason is an overloaded database. Quick wins include fixing any dead internal links and updating outdated plugins. If the problem is hosting overload, consider upgrading your plan or adding a CDN. Also create custom error pages. That way, if an error does pop up, you can guide users back to working sections. This approach shows you value user experience and can help preserve trust.
