TL;DR:
- Kubernetes performance optimization involves tuning cluster components, resource configurations, and control-plane settings to enhance efficiency and reduce latency. Key strategies include adjusting kube-scheduler parameters, enabling CPU and topology managers thoughtfully, ensuring cgroup driver consistency, optimizing etcd storage with appropriate hardware, and scaling addon resources for large clusters. Continuous reevaluation of these configurations is essential as cluster size and workload demands evolve to maintain optimal performance.
Kubernetes performance optimization is the process of tuning cluster components, resource configurations, and control-plane settings to reduce latency, improve scheduling accuracy, and maximize workload efficiency. Most teams focus on application-level fixes while ignoring the deeper levers: kube-scheduler tuning, CPU Manager policies, cgroup driver consistency, etcd hardware alignment, and addon resource scaling. This guide covers all five areas with specific configurations and trade-offs, written for DevOps engineers running production clusters on AWS EKS or self-managed Kubernetes in cloud environments.
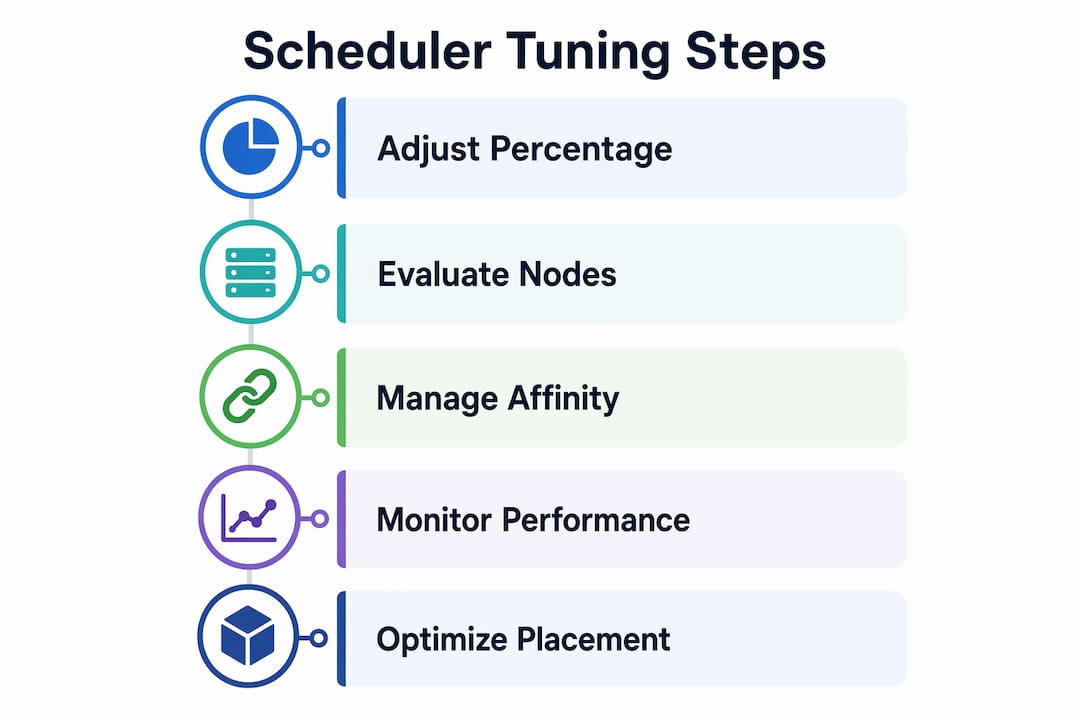
How to optimize Kubernetes performance through scheduler tuning
The kube-scheduler controls where every pod lands in your cluster, and its default configuration is not optimized for large-scale deployments. Two settings define most of its performance behavior: "percentageOfNodesToScore` and opportunistic batching.
percentageOfNodesToScore determines what fraction of nodes the scheduler evaluates before selecting a placement. Setting it between 10% and 100% balances placement accuracy against scheduling throughput. Drop below 10% in a large cluster and you will see degraded pod placement decisions. The scheduler stops evaluating enough candidates to make a genuinely optimal choice, which matters when you have node affinity rules, resource constraints, or topology requirements in play.
The second mechanism worth understanding is opportunistic batching. The scheduler caches filtering and scoring results for similar pods within a 0.5-second window, reusing those results for identical scheduling requests. This significantly increases throughput for workloads that deploy many replicas of the same pod spec, which covers most production deployments. The catch is that it only helps when pods lack affinity constraints that force unique evaluation paths.
Here is a practical tuning sequence for large clusters:
- Start with
percentageOfNodesToScoreat 50% and measure scheduling latency under peak load. - Reduce to 20% if latency is acceptable and throughput is the bottleneck.
- Never go below 10% unless you have validated placement quality with your specific workload mix.
- Enable opportunistic batching by default. It is on unless you have disabled it explicitly.
- Monitor
scheduler_scheduling_duration_secondsin Prometheus to detect regressions after changes.
Pro Tip: If your cluster uses pod affinity or anti-affinity rules extensively, keep percentageOfNodesToScore higher. Batching provides less benefit in those cases, and placement accuracy becomes the dominant concern.
For a broader look at how scheduling fits into Kubernetes orchestration, the configuration principles extend well beyond this single setting.
What resource management strategies improve workload performance?
Running this on your own AWS setup? IT-Magic is an AWS Advanced Tier Partner — we audit, fix, or fully manage it for you.
Get a free consultationThe kubelet ships with two resource managers that most teams never configure: CPU Manager and Topology Manager. Both exist to solve a problem that the default scheduler cannot address, which is CPU cache affinity and NUMA alignment at the node level.

CPU Manager’s static policy is the key setting here. Enabling it assigns exclusive CPUs to containers in Guaranteed QoS pods, eliminating CPU contention for latency-sensitive workloads. A Guaranteed pod requires equal CPU requests and limits, specified as integers. When those conditions are met, the kubelet pins the container to dedicated cores and removes it from the shared CPU pool. The result is predictable CPU performance without the noise introduced by co-located workloads.
Topology Manager extends this further by coordinating NUMA-aware resource allocation across CPUs and devices. The single-numa-node policy aligns all resources to a single NUMA node, reducing memory access latency for workloads that are sensitive to cross-NUMA traffic. The trade-off is real: this policy can constrain scheduling and reduce effective cluster capacity if you have not planned for it.
Key considerations before enabling these features:
- CPU Manager
staticpolicy restricts pod placement because exclusive CPU assignment reduces the pool available for other workloads. Validate cluster capacity before enabling it in production. - Topology Manager policies affect pod admission, not just scheduling. A pod that cannot satisfy the NUMA alignment policy will fail admission entirely.
- Both managers require the kubelet to be restarted with the new configuration. Plan for a rolling node update.
- Integer CPU requests are mandatory for CPU Manager to apply exclusive allocation. Fractional requests like
0.5fall back to the shared pool.
Pro Tip: Run a capacity simulation before enabling CPU Manager in a large cluster. Calculate how many Guaranteed pods with integer CPU requests you expect at peak, then verify the remaining shared pool is sufficient for all other workloads.
These resource managers are particularly relevant in high-throughput Kubernetes environments where latency variance directly affects service-level objectives.
Why matching cgroup drivers matters for cluster stability
Cgroup drivers are one of the most overlooked configuration details in Kubernetes, and a mismatch between the kubelet and the container runtime is one of the hardest problems to diagnose. The two available drivers are systemd and cgroupfs, and they manage the same Linux control groups through different interfaces.
When the kubelet and container runtime use different drivers, resource accounting diverges. The kubelet reports one set of resource consumption numbers while the runtime enforces a different set of limits. Mismatched drivers cause resource accounting drift, leading to unpredictable throttling and cluster instability. Kubernetes documentation is explicit: both components must use the same driver.
Steps to verify and align your cgroup configuration:
- Check the kubelet configuration:
cat /var/lib/kubelet/config.yaml | grep cgroupDriver - Check the container runtime (containerd):
cat /etc/containerd/config.toml | grep SystemdCgroup - If your init system is systemd, both values must reflect the
systemddriver. - After changing either value, restart the affected service and verify node status with
kubectl get nodes.
Kubernetes explicitly recommends the
systemdcgroup driver on any system using systemd as the init system. Usingcgroupfson a systemd host creates two separate cgroup hierarchies competing for control of the same resources.
The subtle performance effects of a mismatch are frequently misdiagnosed as workload bottlenecks. Teams spend hours profiling application code when the actual problem is that the kubelet and runtime disagree on how much CPU a container is consuming. Checking cgroup driver consistency should be the first step in any performance investigation, not an afterthought.
How to optimize etcd storage for control-plane responsiveness
etcd is the key-value store that backs the entire Kubernetes control plane. Every API server read and write goes through it, which means etcd latency directly translates to scheduling delays, slow kubectl responses, and degraded controller behavior.
etcd request latency is bounded by network RTT and disk fsync latency. Under light load with SSDs, typical request latency is under 1 millisecond. Across regions or on spinning disks, that number climbs fast and the control plane degrades visibly. The disk path matters more than most engineers expect because etcd calls fsync on every committed write to guarantee durability.
Hardware and network guidelines for production etcd clusters are specific:
| Factor | Recommendation | Reason |
|---|---|---|
| Disk type | NVMe or SSD | fsync latency under 1 ms required |
| Sequential IOPS | ~500 for heavy clusters | Cloud IOPS figures are concurrent, not sequential |
| Network placement | Same availability zone | Cross-AZ RTT adds consistent latency |
| Memory | 8 GB minimum | Prevents swap, which destroys fsync performance |
| CPU | Dedicated cores | Avoids scheduler contention on write paths |
Cloud providers publish concurrent IOPS figures in their storage documentation, but etcd needs sequential IOPS. A disk rated at 3,000 concurrent IOPS may deliver far fewer sequential IOPS under etcd’s write pattern. Use fio to benchmark sequential write performance before committing to a storage class. For AWS-specific disk performance guidance, the EC2 instance and EBS volume selection directly affects etcd throughput.
Pro Tip: Monitor etcd_disk_wal_fsync_duration_seconds and etcd_disk_backend_commit_duration_seconds in Prometheus. If either metric’s 99th percentile exceeds 10 ms consistently, your disk is the bottleneck and no amount of application tuning will fix it.
How to scale cluster addons for large Kubernetes environments
Cluster addons like CoreDNS, kube-proxy, metrics-server, and CNI plugins ship with resource requests and limits tuned for small clusters. Default addon limits cause CPU throttling and memory evictions in large clusters, which degrades DNS resolution, network policy enforcement, and metrics collection across the board.
The fix requires two parallel actions: scaling resource requests and limits proportionally to cluster size, and assigning the right PriorityClass to critical addons.
- CoreDNS memory limits should scale with the number of services and pods. A cluster with 500 nodes and thousands of services needs significantly more than the default 170 Mi limit.
- Metrics-server CPU requests should increase as the number of nodes grows, since it scrapes every node on a fixed interval.
- Mark cluster-essential components with
system-cluster-criticalPriorityClass to prevent eviction under node pressure. - Set requests equal to or close to limits for addon pods to avoid burstable QoS behavior, which makes them candidates for eviction under memory pressure.
- Review addon performance metrics after every significant cluster scaling event. Addon resource needs grow with cluster size, and a configuration that worked at 50 nodes will fail at 200.
Ignoring addon scaling is one of the most common causes of mysterious performance degradation in growing clusters. DNS timeouts, slow pod startup, and unreliable network policies are often traced back to a CoreDNS pod that has been CPU-throttled for weeks.
Key takeaways
Kubernetes performance tuning requires consistent configuration across the scheduler, kubelet resource managers, cgroup drivers, etcd storage, and cluster addons. No single change delivers full optimization.
| Point | Details |
|---|---|
| Tune the scheduler first | Set percentageOfNodesToScore between 10% and 50% and verify placement quality under load. |
| Enable CPU Manager selectively | Use the static policy only for Guaranteed pods with integer CPU requests after validating capacity. |
| Verify cgroup driver consistency | Confirm kubelet and container runtime use the same driver before investigating any performance issue. |
| Benchmark etcd disk with fio | Sequential IOPS matter more than concurrent IOPS; target SSDs with sub-1 ms fsync latency. |
| Scale addon limits with cluster size | Increase CoreDNS and metrics-server resources proportionally and assign system-cluster-critical PriorityClass. |
Where most teams get Kubernetes tuning wrong
After working on Kubernetes infrastructure across dozens of production environments, the pattern I see most often is teams optimizing the wrong layer. They profile application code, adjust JVM heap sizes, and tune connection pools while the control plane is quietly saturated.
etcd latency is the silent killer. A cluster where etcd fsync takes 20 ms on every write will show scheduling delays, slow API responses, and controller reconciliation lag. None of those symptoms point obviously to disk performance, so teams chase application bottlenecks for weeks. The fix is a disk benchmark and a storage class change, not a code review.
The second mistake is treating cgroup driver configuration as a one-time setup task. In practice, I have seen clusters where a node replacement or runtime upgrade silently introduced a driver mismatch. The resulting throttling behavior looked exactly like a memory leak in the application. Early verification of cgroup consistency, built into your node provisioning pipeline, eliminates an entire category of hard-to-diagnose issues.
The third pattern worth calling out is enabling CPU Manager’s static policy without capacity planning. The policy is genuinely useful for latency-sensitive workloads, but it reduces the effective CPU pool available for other pods. In a cluster running close to capacity, enabling it without adjusting pod scheduling can trigger a wave of admission failures that looks like a cluster outage.
The teams that get Kubernetes performance right treat it as a continuous practice, not a one-time configuration. Scheduler settings, resource manager policies, and addon limits all need revisiting as cluster size and workload mix evolve.
— Oleksandr
Get expert Kubernetes performance tuning from IT-Magic

IT-Magic has delivered Kubernetes performance tuning across 700+ projects for clients in fintech, retail, and enterprise environments. Our certified AWS engineers diagnose control-plane bottlenecks, configure kubelet resource managers, and scale addon configurations for clusters of any size. If your team is dealing with scheduling latency, etcd degradation, or unexplained throttling, our Kubernetes support services provide hands-on remediation and long-term operational guidance. See how we helped INTERTOP achieve AWS cost reduction through scalable infrastructure design. Contact IT-Magic to get a performance assessment tailored to your cluster.
FAQ
What is the most impactful Kubernetes performance tuning change?
Verifying cgroup driver consistency between the kubelet and container runtime is the highest-priority check because a mismatch causes resource accounting drift that mimics application-level bottlenecks and is rarely diagnosed correctly.
How does percentageOfNodesToScore affect scheduling performance?
Lowering this value increases scheduling throughput by reducing the number of nodes evaluated per pod, but values below 10% risk poor placement decisions in large clusters.
When should I enable CPU Manager’s static policy?
Enable it for latency-sensitive workloads running in Guaranteed QoS pods with integer CPU requests. Validate available cluster capacity first, since the policy reduces the shared CPU pool and can cause admission failures if resources are constrained.
Why does etcd performance affect the entire Kubernetes cluster?
Every Kubernetes API operation reads from or writes to etcd. When disk fsync latency exceeds acceptable thresholds, scheduling delays and controller reconciliation lag follow across the entire cluster, regardless of application-level performance.
How often should addon resource limits be reviewed?
Review addon limits after every significant cluster scaling event. Default addon limits are tuned for small clusters and will cause CPU throttling and memory evictions as node and pod counts grow.
Recommended
- Top Kubernetes use cases to optimize cloud infrastructure
- How to Set Up Kubernetes: Step-by-Step Guide for IT Leaders
- Kubernetes orchestration explained: ensure scalability and control
- AWS Cloud Performance Optimization: A Proven Process
Alexander founded IT-Magic, an AWS Advanced Tier Services Partner delivering DevOps, cloud architecture, and managed services since 2010. He holds:
- AWS Certified Solutions Architect – Professional
- AWS Certified DevOps Engineer – Professional
- AWS Certified Security – Specialty
- AWS Certified Advanced Networking – Specialty
Talk to a certified AWS team trusted by INTERTOP, Foxtrot, Pandora, and J.Hilburn.
Get a free consultation