
TL;DR:
- Unmonitored cloud environments degrade performance quietly and at high costs due to missed issues and noise. Building a monitoring system focused on service health, automation, and continuous improvement ensures rapid incident detection and resolution. Prioritizing service impact over infrastructure metrics and integrating AI/ML correlation reduces alert fatigue and enhances diagnostic clarity.
Unmonitored cloud environments fail quietly and expensively. A misconfigured alert threshold, a new microservice deployed without instrumentation, a third-party CDN latency spike nobody noticed until customers started complaining. These are the everyday realities of a broken cloud monitoring process. This guide walks through exactly how to build and optimize a monitoring workflow that catches real problems fast, reduces noise, and gives your team the context needed to resolve incidents before they become outages. From prerequisites and signal collection to alerting, incident response, and continuous improvement.
Table of Contents
- Key takeaways
- The cloud monitoring process: prerequisites and preparation
- Step-by-step cloud monitoring workflow implementation
- Common cloud monitoring challenges and how to address them
- Measuring and improving your cloud monitoring process
- My take on cloud monitoring in complex environments
- How Itmagic helps you optimize cloud monitoring
- FAQ
Key takeaways
Running this on your own AWS setup? IT-Magic is an AWS Advanced Tier Partner — we audit, fix, or fully manage it for you.
Get a free consultation| Point | Details |
|---|---|
| Start with service health goals | Anchor monitoring on availability, latency, and error rates tied to customer impact, not just server metrics. |
| Collect all four signal types | Instrument metrics, logs, traces, and continuous profiling together for complete diagnostic coverage. |
| Fight alert fatigue with correlation | Use multi-signal conditions and AI/ML event correlation to cut false positives and reduce alert noise. |
| Automate incident workflows | Attach runbooks to alerts and use automated routing to speed up on-call response significantly. |
| Review monitoring regularly | Treat monitoring configuration as living infrastructure that needs the same care as your codebase. |
The cloud monitoring process: prerequisites and preparation
Before you touch a single alert policy, you need an honest picture of what you’re actually running. Most teams skip this step and end up monitoring 60% of their infrastructure while assuming 100% coverage. That assumption kills incident response.
Start with automated asset discovery. Manual inventory is obsolete the moment a new service spins up. Use your cloud provider’s native discovery tools or a platform like AWS Config to continuously map resources, dependencies, and relationships. This becomes the foundation your entire cloud monitoring workflow sits on.
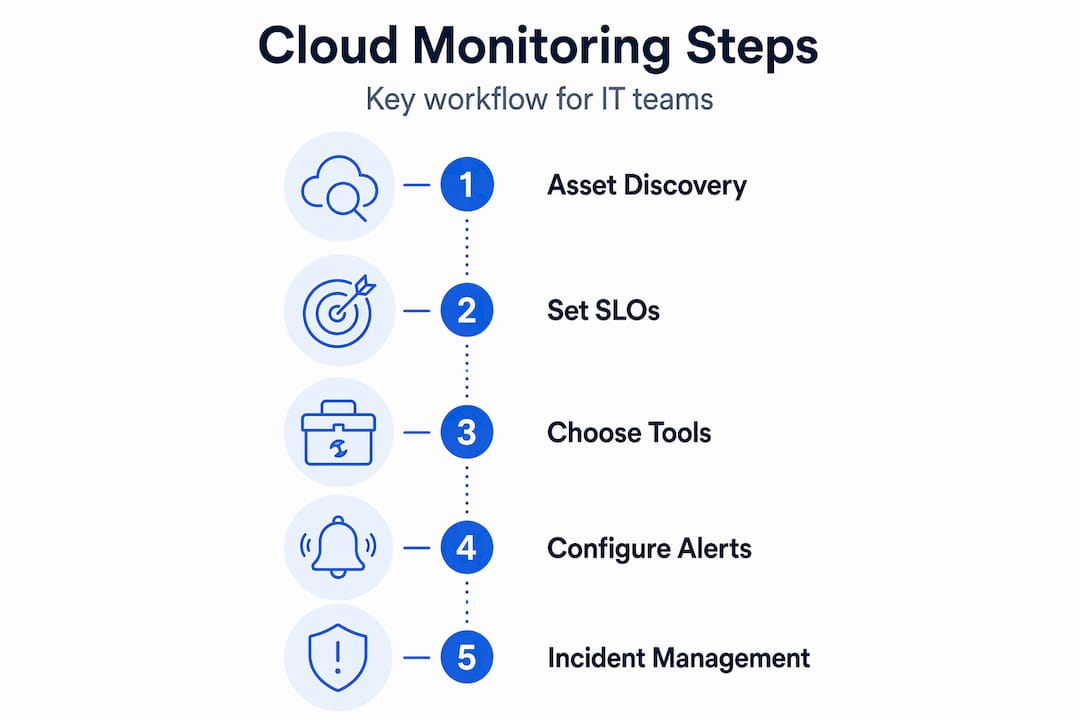
Once you know what exists, define what healthy looks like. This sounds obvious but most teams define monitoring goals around infrastructure components rather than service outcomes. The smarter approach is to anchor on service health and customer impact.
Service-level monitoring focus areas:
- Availability: Is the service responding to requests?
- Latency: Are responses fast enough to meet SLOs?
- Error rate: What percentage of requests are failing?
- Saturation: Are any resources approaching capacity limits?
Service health monitoring anchored on availability, latency, and error rates identifies priority areas faster than component-only monitoring. That shift in perspective changes how your team triages every incident.
With goals defined, select your monitoring platform. Given that 82% of containerized workloads in production run on Kubernetes, your tooling needs to support OpenTelemetry standards for vendor-neutral telemetry collection. Lock-in to a proprietary data format costs you later. For a practical look at how monitoring fits into your broader cloud infrastructure, the Itmagic article on cloud infrastructure monitoring covers the performance and cost dimensions in detail.
Pro Tip: Define at least three SLOs before configuring any alert. Without SLOs, you have no principled way to set alert thresholds, and your policies will drift toward either too noisy or too silent.
Finally, establish your incident management framework before incidents happen. Define severity levels (P1 through P4 is a common model), assign service ownership, and connect your monitoring platform to notification channels. This scaffolding makes everything downstream work.
Step-by-step cloud monitoring workflow implementation
With your foundation set, here is how to implement the actual cloud monitoring workflow from data collection through incident response.

1. Instrument all four signal types.
Metrics give you the numbers. Logs give you the narrative. Traces show you how requests flow across services. Continuous profiling complements the other three by identifying code-level bottlenecks that cause performance issues. Most teams treat profiling as optional. It is not. It closes the diagnostic gap that metrics and traces leave open when latency spikes but nothing else looks wrong.
2. Centralize telemetry on a unified platform.
Fragmented visibility across four separate dashboards is not monitoring. It is noise with extra steps. Unified telemetry platforms that correlate metrics, logs, traces, and events reduce context switching and accelerate incident resolution. The correlation happens automatically rather than requiring an engineer to mentally stitch together data from disconnected tools.
3. Configure alerting with multi-signal conditions.
Single-metric thresholds generate the most false positives. An alert that fires only when CPU exceeds 85% and error rate exceeds 2% and latency is above the P95 SLO is a far better signal than any one condition alone. Monitoring checks run every 30 to 60 seconds for real-time anomaly detection, so you have the data granularity to support compound conditions.
4. Implement smart alert grouping and routing.
Alert grouping mapped to service ownership and severity levels reduces noise and helps on-call teams focus on what matters. An alert for a payment service database connection pool should route to the database team owner, not a generic ops channel where it gets lost.
5. Automate incident workflows.
This is where most teams leave significant time savings on the table. Use tools like AWS EventBridge, Pub/Sub, or Cloud Functions to trigger automated workflows when incidents are created. Attaching runbooks to alerts and automating notification channels means responders know exactly what to do the moment they are paged, rather than searching for documentation at 2 AM.
6. Build shared real-time dashboards for incidents.
During an active incident, everyone looking at different data creates coordination overhead. A shared timeline view with annotations lets your team correlate a deployment event with a latency spike without a 20-minute Slack thread to figure out what changed.
Pro Tip: Incident management is only effective when alert policies are tightly integrated with notification channels and runbooks. Test your full alerting pipeline, including notification delivery and runbook access, on a scheduled basis, not just when a real incident fires.
| Approach | Single-metric alerting | Multi-signal alerting |
|---|---|---|
| False positive rate | High | Significantly lower |
| Diagnostic context | Limited | Rich, correlatable |
| On-call fatigue | High | Reduced |
| Setup complexity | Low | Medium |
| Time to root cause | Slow | Fast |
Common cloud monitoring challenges and how to address them
Even well-designed monitoring breaks down over time. Here are the most common failure modes and what to do about them.
Alert fatigue is the most immediate problem. When on-call engineers start ignoring pages because 80% of them are false positives, your monitoring is actively dangerous. The fix is signal correlation combined with behavior-based thresholds rather than static cutoffs. AI/ML-based event correlation can reduce false positives by up to 95%, which transforms alert quality from noise to signal.
Monitoring decay is slower and more dangerous. Every environment change, new service deployment, or infrastructure scaling event creates potential gaps in your coverage. Automated discovery and onboarding keeps monitoring accurate as systems evolve. Without it, you discover the gap when an unmonitored service fails in production.
Blind spots from external dependencies catch teams off guard consistently. Your application health depends on DNS resolution, CDN performance, and third-party API response times. None of these are inside your infrastructure perimeter. Incorporate synthetic monitoring for external endpoints and third-party dependency checks into your cloud health check process.
Cost spikes without visibility are increasingly common as cloud usage grows. Integrating cost anomaly detection into your monitoring dashboards catches unexpected spend before it becomes a budget conversation with finance. Think of cost as the fifth monitoring signal for cloud teams.
Config drift in alert policies is subtle but destructive. An alert threshold set six months ago for a service handling 10,000 requests per day is probably wrong today if that service now handles 200,000. Schedule quarterly reviews of monitoring baselines and alert conditions as a standing team practice.
Successful cloud monitoring teams invert traditional methods by prioritizing service health and customer impact first, then connecting infrastructure dependencies. This inversion is not just philosophical. It changes which alerts get created, which get acted on, and which get ignored.
Measuring and improving your cloud monitoring process
Setting up monitoring is not the finish line. The value accumulates through continuous improvement. Here is how to measure whether your cloud monitoring process is actually working.
1. Track mean time to resolution (MTTR). This is the primary output metric. If MTTR is not improving over time, your monitoring investments are not translating into faster incident response.
2. Measure alert volume and false positive rate. High volume with a high false positive rate signals a tuning problem. A team receiving 200 alerts per week with 70% false positives is operationally worse off than a team receiving 40 alerts with 5% false positives.
3. Analyze post-incident timelines. Incident timeline data with annotations shows exactly where monitoring gaps exist. Did you detect the problem from an alert or a customer report? How long did detection take after the initial anomaly? These questions reveal where to invest next.
4. Incorporate cost metrics into monitoring dashboards. Cloud system performance monitoring that ignores spend is incomplete. Cost anomaly detection integrated alongside performance metrics gives you a full picture of operational health.
5. Invest in AI/ML-based correlation. As your environment grows, manual alert tuning cannot keep pace. AI-driven event correlation tools that learn normal behavior patterns continuously improve signal quality without additional engineering effort.
6. Benchmark and upgrade tooling. Cloud service monitoring tools evolve quickly. Tools that were best-in-class two years ago may lack OpenTelemetry support, AI correlation features, or Kubernetes-native instrumentation. Re-evaluate your platform annually against your current environment requirements.
The teams that get monitoring right treat it as a product with its own backlog, SLOs, and release cycles. Not a one-time project that gets done and forgotten.
My take on cloud monitoring in complex environments
I have seen teams spend months selecting and deploying monitoring platforms only to end up with the same fragmented, noisy alerting they started with. The platform was not the problem. The philosophy was.
The single most impactful shift I have seen is anchoring monitoring on service health rather than infrastructure components. When you ask “is this service meeting its SLO?” instead of “is this server’s CPU under 80%?”, every subsequent decision, which alerts to create, which dashboards to build, which incidents to escalate, becomes dramatically clearer.
Tool sprawl is the second failure pattern I encounter regularly. Teams run four or five monitoring tools simultaneously because each one was the best option at the time of adoption. The result is fractured context, no single source of truth during incidents, and engineers who know how to use none of the tools well. Consolidating onto a unified telemetry platform is painful short-term and transformative long-term.
On alert fatigue: the instinct is to write more specific alert conditions. That helps, but automation is what actually solves it. Automated routing, automated runbook attachment, automated escalation. When your on-call engineer receives an alert that already knows which team owns it, links to the relevant runbook, and has opened an incident ticket, response quality improves regardless of how tired that engineer is.
What I find genuinely exciting about where cloud performance monitoring is heading is continuous profiling at scale. The ability to connect a service latency symptom directly to a specific function consuming excessive CPU, without requiring a manual profiling session, closes a diagnostic gap that has existed since distributed systems became the norm. This is not a future capability. It is available now and most teams are not using it.
Monitoring is never done. Cloud environments change constantly and your monitoring configuration needs to change with them.
— Oleksandr
How Itmagic helps you optimize cloud monitoring
Building an effective monitoring setup across AWS and Kubernetes environments requires more than good tooling. It requires architectural decisions that are right for your specific stack, team size, and compliance requirements.
Itmagic has delivered 700+ infrastructure projects since 2010, with deep specialization in AWS infrastructure support covering monitoring architecture, incident response automation, and operational best practices. If your environment runs containerized workloads, Itmagic’s Kubernetes support services cover monitoring and incident response for EKS and ECS deployments specifically. For teams dealing with unexpected cost spikes, the AWS cost optimization practice integrates cost anomaly detection directly into your monitoring strategy. Whether you are starting from scratch or overhauling a monitoring setup that has grown into chaos, Itmagic can assess your current state and build the monitoring workflow your team actually needs.
FAQ
What is the cloud monitoring process?
The cloud monitoring process is the continuous collection, analysis, and alerting on telemetry data from cloud services, infrastructure, and applications. It covers metrics, logs, traces, and profiling signals to detect and resolve performance and availability issues before they affect users.
How often should cloud monitoring checks run?
Effective cloud security and performance monitoring checks run every 30 to 60 seconds to detect anomalies in real time. This frequency gives teams enough data granularity to set compound alert conditions and catch issues before they escalate.
What causes alert fatigue in cloud monitoring?
Alert fatigue is caused by high false positive rates, single-metric threshold alerting, and lack of signal correlation. AI/ML event correlation can reduce false positives by up to 95%, which is the most effective way to restore trust in your alerting pipeline.
What is monitoring decay?
Monitoring decay happens when your environment changes faster than your monitoring configuration is updated. New services, scaling events, and infrastructure changes create gaps in coverage. Automated discovery and onboarding workflows prevent this by keeping monitoring aligned with the actual running environment.
How do you measure cloud monitoring effectiveness?
Track MTTR, weekly alert volume, and false positive rates as your primary metrics. A healthy monitoring process shows declining MTTR, stable or decreasing alert volume, and a false positive rate below 10% across all alert policies.
Recommended
- Cloud infrastructure monitoring: Boost performance and cut costs
- How to monitor AWS environments: step-by-step guide
- What is monitoring in DevOps? Improve delivery and resilience
- Network Security Strategies for Cloud Environments in 2026
Alexander founded IT-Magic, an AWS Advanced Tier Services Partner delivering DevOps, cloud architecture, and managed services since 2010. He holds:
- AWS Certified Solutions Architect – Professional
- AWS Certified DevOps Engineer – Professional
- AWS Certified Security – Specialty
- AWS Certified Advanced Networking – Specialty
Talk to a certified AWS team trusted by INTERTOP, Foxtrot, Pandora, and J.Hilburn.
Get a free consultation