TL;DR:
- Effective infrastructure monitoring improves cloud cost savings, system reliability, and early issue detection for fintech. It involves continuous observation of hardware, software, networks, and security, enabling proactive management and cost optimization. Adopting modern practices like SLOs, OpenTelemetry, automation, and ownership reduces downtime and operational expenses significantly.
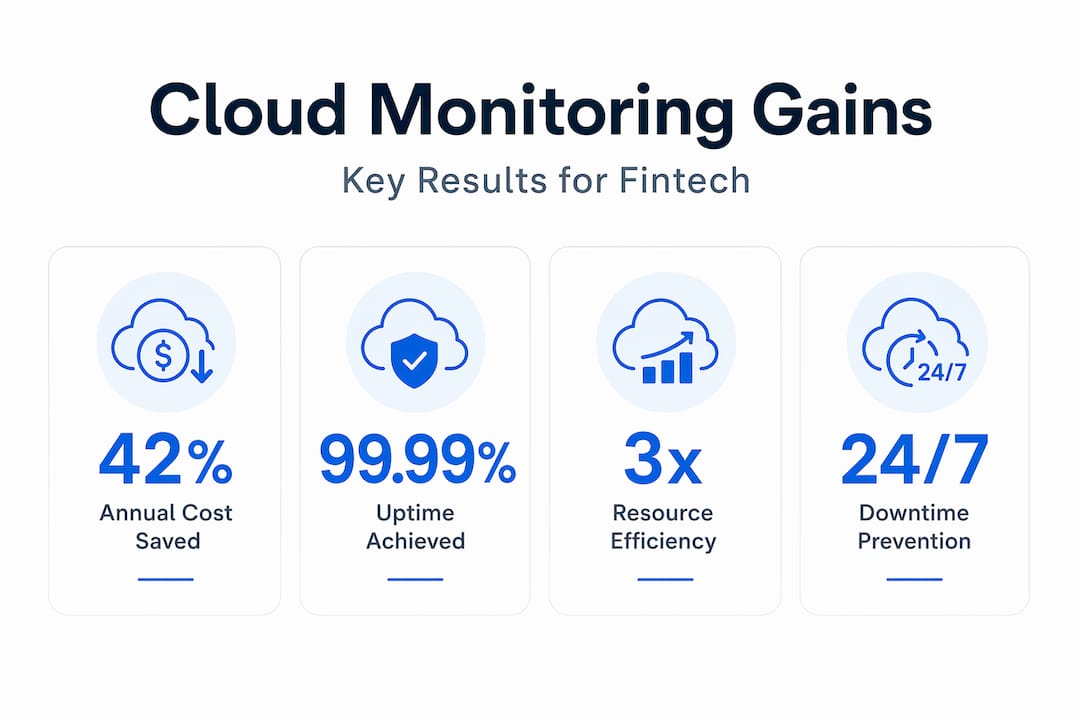
Scaling your cloud infrastructure does not automatically mean your costs spiral out of control or your reliability suffers. Many engineering leaders assume that more complexity equals higher bills and more outages. The data says otherwise. Fintechs using advanced monitoring visibility have achieved 42% cloud cost reductions worth $2.4M per year by identifying orphaned resources and right-sizing capacity. This article breaks down what infrastructure monitoring actually covers, why it directly affects your bottom line, and how to apply modern practices that keep your startup or fintech operation ahead of disruptions.
Table of Contents
- What is infrastructure monitoring and why it’s critical
- Business impact: Cost savings, uptime, and resource optimization
- Modern best practices: From metrics to automation
- Hidden risks and real-world edge cases
- A CTO’s lens: What most monitoring playbooks ignore
- Take your cloud monitoring to the next level
- Frequently asked questions
Key Takeaways
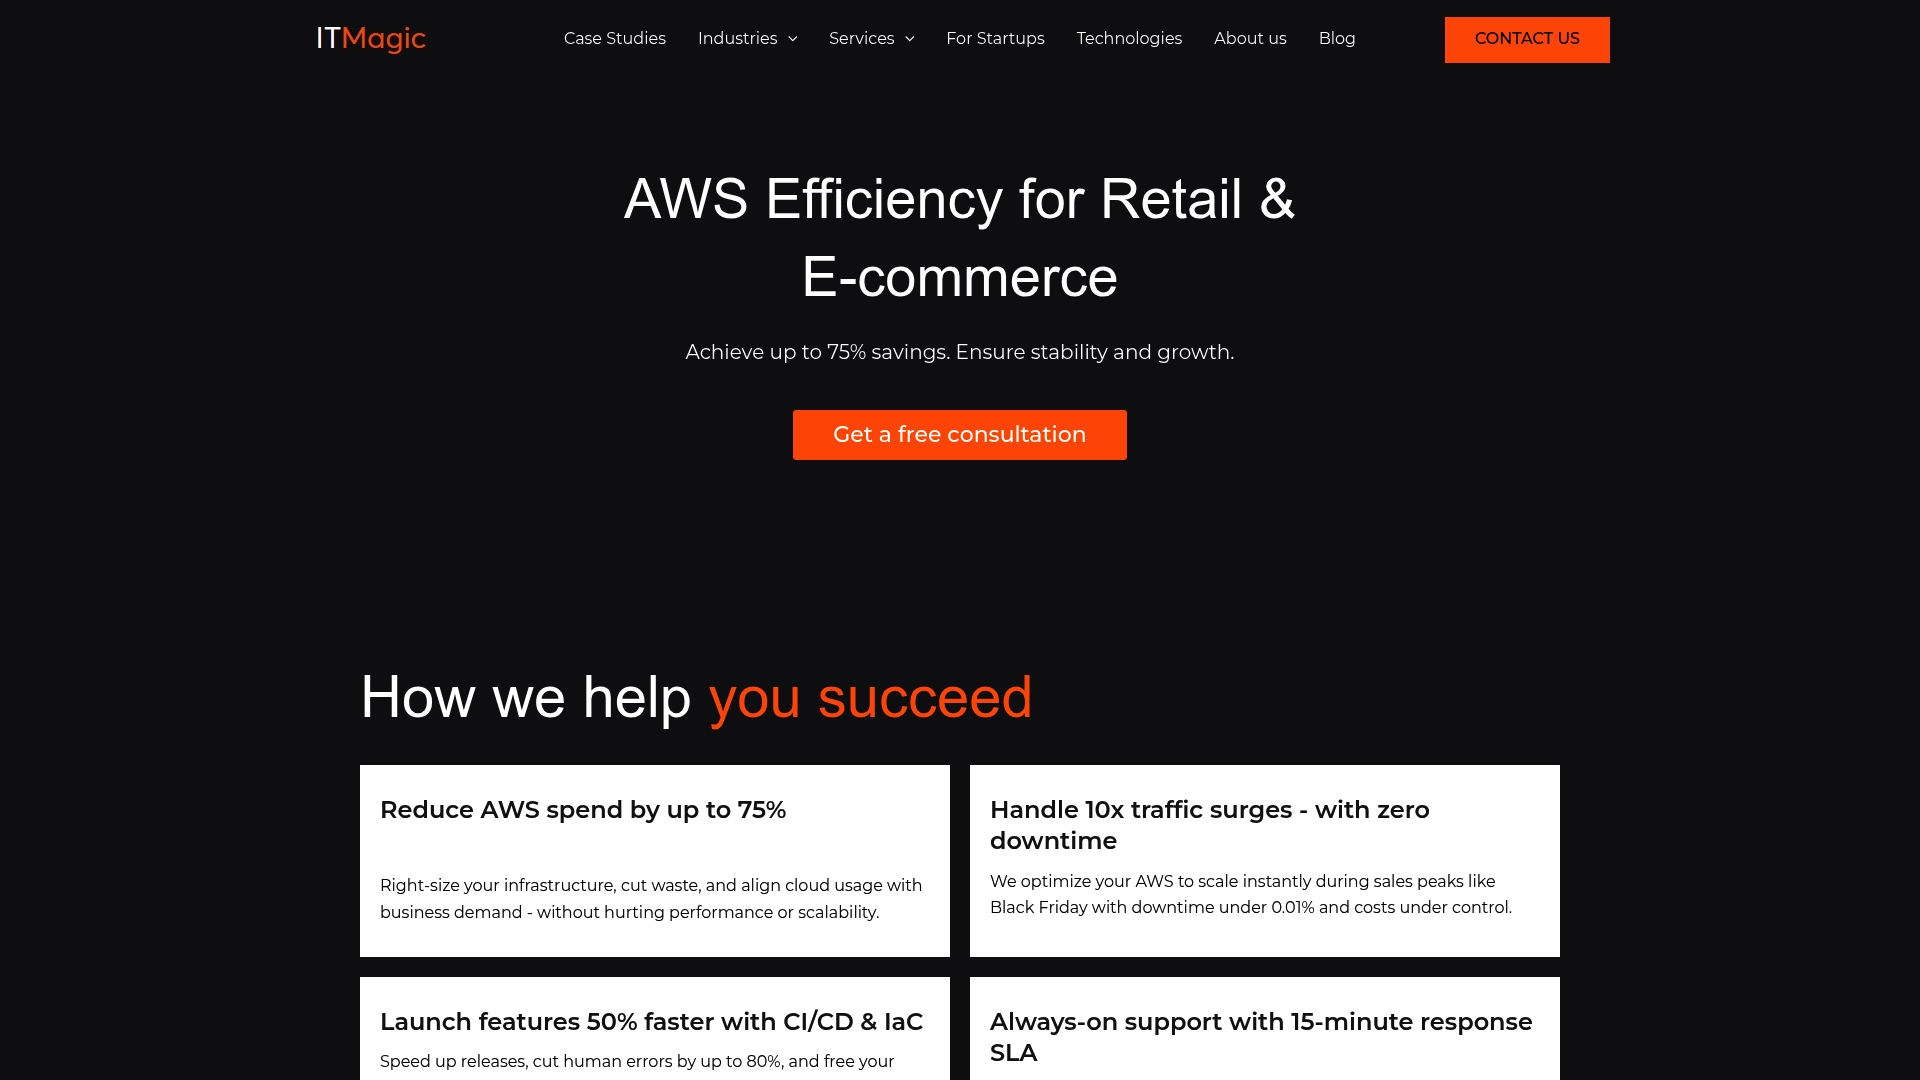
Running this on your own AWS setup? IT-Magic is an AWS Advanced Tier Partner — we audit, fix, or fully manage it for you.
Get a free consultation| Point | Details |
|---|---|
| Monitoring slashes costs | Fintechs save up to 42 percent annually by identifying waste and right-sizing resources. |
| Downtime drops dramatically | Advanced monitoring reduces mean time to recovery and outage frequency for critical systems. |
| Modern practices matter | Automation, SLOs, and chaos engineering ensure reliability in today’s dynamic environments. |
| Hidden risks exist | Unique cloud-native and AI workloads require monitoring beyond traditional metrics. |
| Culture beats tools | Monitoring success depends on team ownership and a proactive mindset, not just dashboards. |
What is infrastructure monitoring and why it’s critical
Infrastructure monitoring is the continuous observation of every layer in your technology stack. That means hardware, software, cloud services, networks, and application layers all feeding data into a unified view. It is not just about uptime dashboards or setting up alerts that fire at 3 a.m. Real infrastructure monitoring gives your team the situational awareness to prevent problems before users ever notice them.
For startups and fintech companies specifically, the stakes are high. Regulatory compliance, PCI DSS requirements, and user trust all depend on consistent performance and availability. A single unexpected outage during peak transaction hours can cost far more than a month of monitoring tooling.
Here is what effective infrastructure monitoring actually covers:
- Availability tracking: Detects when services, endpoints, or entire regions go down
- Performance metrics: CPU, memory, disk I/O, and network throughput across instances and containers
- Security event logging: Flags suspicious access patterns, unauthorized config changes, and vulnerability exposure
- Cost visibility: Tags resource consumption back to services, teams, or features
- Compliance auditing: Maintains logs required for SOC 2, PCI DSS, and other frameworks
Understanding monitoring in DevOps goes beyond tool selection. It is about building feedback loops that accelerate delivery while keeping systems stable.
Cloud monitoring prevents downtime from traffic spikes, vulnerabilities, and inefficient resource use, ensuring your services maintain optimal performance and availability. Most teams treat monitoring reactively, pulling up dashboards only when something breaks. The teams that pull ahead are those who use monitoring data to drive architectural decisions, capacity planning, and cost governance on an ongoing basis.
Understanding IT infrastructure essentials helps frame monitoring not as a single tool but as an operational discipline that spans your entire environment.
Pro Tip: If your team spends more than 20% of incident response time just figuring out where the problem is, your monitoring coverage has gaps. Effective observability should cut that investigation phase to under five minutes.
“You can’t manage what you can’t measure” is overused, but it remains true. For fintech teams operating under tight SLAs and compliance requirements, visibility is not a nice-to-have — it is your operational foundation.
Business impact: Cost savings, uptime, and resource optimization
Understanding the components of monitoring is one thing. Seeing what it actually delivers financially is what gets engineering leaders to act. The numbers here are not incremental improvements. They are transformational.

Industry data shows fintech teams achieving 42% cloud cost reductions through monitoring-driven visibility into orphaned resources and right-sizing, with another case showing 35% savings using Grafana and Prometheus together. IBM Instana achieved 30%+ cost reductions on AWS through observability improvements alone.
| Outcome | Improvement range | Primary driver |
|---|---|---|
| Cloud cost reduction | 30% to 42% | Orphaned resource cleanup, right-sizing |
| Mean time to recovery (MTTR) | 60% to 85% faster | Automated alerting, root cause visibility |
| Incident frequency | 45% fewer outages | Proactive anomaly detection |
| Incident resolution speed | 60% faster | Structured alert routing |
| Engineering labor saved | Significant reduction | Automation replacing manual checks |
The mechanisms behind these numbers are straightforward once you know where to look:
- Orphaned resource detection: Monitoring tools surface idle EC2 instances, unattached EBS volumes, and forgotten load balancers that quietly consume budget. Without visibility, these resources accumulate and nobody notices until the bill arrives.
- Right-sizing automation: Real-time CPU and memory utilization data makes it obvious when you are running m5.2xlarge instances at 12% average load. Monitoring makes right-sizing a data-driven decision rather than a guessing game.
- Predictive maintenance: Pattern detection in disk I/O and memory pressure allows your team to act before a failure, not after. Proactive monitoring with real-time analytics optimizes resource allocation, reduces labor costs via automation, and enables predictive maintenance that avoids costly unplanned downtime.
For a detailed approach to reducing cloud spend, our cloud cost reduction strategies outline proven steps taken across dozens of AWS environments. For a broader strategic view, the cloud cost optimization guide walks through frameworks that CIOs use to govern spend at scale.
One practical example: in our AWS migration case study, monitoring-driven insights played a direct role in eliminating unused infrastructure after migration, translating immediately into lower monthly AWS invoices.
The compounding effect matters here. Every dollar saved on cloud waste is a dollar that can fund product development, security improvements, or compliance programs. For startups with finite runway, monitoring is not overhead. It is capital efficiency.
Modern best practices: From metrics to automation
Knowing monitoring matters is not enough. How you implement it determines whether you get real operational gains or just more noise. Modern monitoring has moved far beyond setting CPU thresholds and emailing ops teams.
Here is a step-by-step framework that reflects what high-performing engineering teams actually do:
- Define SLOs and SLIs first. Service Level Objectives (SLOs) and Service Level Indicators (SLIs) give every alert context. Before deploying any tool, agree on what “good” looks like for latency, error rate, and availability. This prevents alert fatigue by tying notifications to customer impact rather than arbitrary thresholds.
- Adopt OpenTelemetry for instrumentation. OpenTelemetry is an open-source framework that standardizes how you collect traces, metrics, and logs across services. It avoids vendor lock-in and works across containers, serverless functions, and traditional instances.
- Move from static thresholds to anomaly detection. Static alerts fire constantly in dynamic environments. Modern tools use baseline modeling to detect deviations from normal behavior, reducing false positives dramatically.
- Manage monitoring configs as code. Infrastructure as Code (IaC) applies to monitoring too. Define your dashboards, alert rules, and notification channels in version-controlled configuration files. This makes monitoring consistent across environments and prevents configuration drift.
- Run chaos engineering experiments. Deliberately inject failures in staging environments to validate that your monitoring actually detects what it should. Teams that skip this step often discover coverage gaps only during real incidents.
Infrastructure monitoring best practices reinforce that defining SLOs and SLIs, using OpenTelemetry, structured alerting over static thresholds, IaC for monitoring configs, and chaos engineering testing are the pillars of modern observability programs.
| Approach | Traditional monitoring | Modern monitoring |
|---|---|---|
| Alert triggers | Static CPU/memory thresholds | SLO-based anomaly detection |
| Instrumentation | Agent-specific, vendor-locked | OpenTelemetry standard |
| Config management | Manual, UI-driven | IaC, version controlled |
| Incident validation | Post-incident review | Chaos engineering proactive testing |
| Container support | Limited, instance-focused | Service endpoint tracking |
| Automation level | Reactive notifications | Auto-remediation workflows |
Automating cloud operations is where monitoring moves from a cost center to a competitive advantage. When your monitoring detects a scaling event and triggers an automated response, you eliminate both the outage and the engineering hours that manual intervention would have required.
Automated alerting systems reduce response latency and ensure the right people are notified with the right context, every time. This directly connects to the DevOps and cost savings relationship where tighter feedback loops and automation reduce both operational risk and ongoing labor costs.
Pro Tip: Use push-based monitoring models for containerized and serverless environments. Pull-based systems struggle with the ephemeral nature of containers, often missing short-lived failures entirely because the instance disappears before the next scrape cycle.
Hidden risks and real-world edge cases
Even teams following best practices encounter monitoring blind spots. Some of the most expensive incidents happen not because monitoring was absent, but because it was looking in the wrong places.
Cloud-specific failure modes like auto-scaling to zero, cold starts in serverless functions, and load balancer silent failures are missed by monitoring systems designed for traditional infrastructure. These environments require tracking service endpoints, not individual instances.
Here are the edge cases that most commonly blindside fintech and startup engineering teams:
- Auto-scaling to zero: Your service scales down completely during a quiet period, and the next request gets a cold start delay that looks like a timeout to users. Traditional uptime checks miss this entirely.
- Serverless cold start cascades: Multiple Lambda functions experiencing simultaneous cold starts during a traffic spike can create latency spikes that hit SLOs without triggering any single-function alert.
- Load balancer health check gaming: Instances report healthy to the load balancer while failing real user requests due to application-layer issues that the health check does not test.
- Container IP churn: Microservice environments where pods are constantly recycled mean that IP-based monitoring loses track of services within seconds.
- Monitoring platform circular dependency: Your alerting system is hosted on the same infrastructure it monitors. An infrastructure failure silently kills your alerts too.
- AI workload output quality gaps: Traditional metrics track latency and error rates but miss whether an LLM-based feature is returning degraded or incorrect outputs.
Monitoring reliably at scale surfaces a critical organizational pattern: when no single team owns the monitoring process, outages happen not because of tool failures but because accountability was unclear. Tooling is only half the answer.
“The root cause of most monitoring failures isn’t the tool. It’s the absence of a clear owner who is responsible for the health of the monitoring system itself.”
As AI-driven workloads become more common, even AI in supply chain and AI inventory management applications need extended monitoring beyond latency. Output quality, model drift, and decision accuracy require new evaluation metrics that traditional infrastructure monitoring does not provide out of the box.
A CTO’s lens: What most monitoring playbooks ignore
Most monitoring guides spend 90% of their content on tools and dashboards. That is useful but incomplete. After working with 300+ clients across fintech and startup environments, we have learned that the teams with the best monitoring outcomes share two traits that have nothing to do with tool selection: clear ownership and a proactive culture.
Ownership means one team or one named engineer is accountable for the health of the monitoring system. Not the health of the application. The health of the monitoring itself. Without this, monitoring configurations drift, alert rules go stale, and dashboards accumulate irrelevant panels until nobody trusts them anymore.
Culture means that engineering leaders treat monitoring data as a strategic input, not just an ops concern. When a CTO reviews reliability metrics in weekly planning the same way they review product velocity, teams start building with observability in mind from the start. That shift is what separates reactive firefighting from genuinely proactive operations.
For lean startup teams, external monitoring deserves far more emphasis than most playbooks give it. Internal dashboards show you what your systems report about themselves. External synthetic monitoring shows you what your users actually experience. The gap between these two views is often where your most damaging incidents hide. Cloud monitoring integrated with DevOps workflows shifts teams from reactive to proactive operations and provides the customer-facing visibility that internal tools alone cannot deliver.
DevOps monitoring integration is not a technical exercise. It is an organizational one. When monitoring is embedded in your deployment pipeline, every release automatically validates that performance and reliability have not regressed. This is the kind of systematic accountability that fintech compliance frameworks increasingly require.
The practical advice for CTOs: establish monitoring ownership and escalation paths before you need them. Define who owns alert rules, who reviews them quarterly, and who has authority to silence alerts versus fixing the underlying issue. Document it. This simple structure eliminates a surprising number of incidents before they reach production.
Take your cloud monitoring to the next level
Applying these monitoring strategies at scale requires more than reading about them. It requires certified expertise, proven tooling, and infrastructure experience across hundreds of real production environments.
At IT-Magic, we have delivered 700+ infrastructure projects for startups and fintech companies since 2010, with AWS Advanced Tier Partner credentials and teams specialized in DevOps, security, and cloud architecture. Our AWS cost optimization service directly targets the monitoring-driven savings discussed in this article, from orphaned resource cleanup to right-sizing automation. For containerized environments, our Kubernetes support practice covers the monitoring complexity that comes with EKS and ECS deployments. If your team is ready to close monitoring gaps, reduce cloud spend, and build real reliability into your infrastructure, let’s talk.
Frequently asked questions
How does infrastructure monitoring reduce cloud costs?
By making resource usage visible, monitoring helps teams eliminate waste, right-size capacity, and automate cost-saving actions. Fintech teams using monitoring have achieved 42% cost reductions through visibility into orphaned resources and right-sizing opportunities.
What’s the difference between proactive and reactive monitoring?
Proactive monitoring detects issues before they cause outages, while reactive monitoring only responds after problems occur. Proactive monitoring with real-time analytics also enables predictive maintenance and automated remediation that reduces labor costs significantly.
When is external monitoring better than internal dashboards?
External monitoring reveals user-impacting issues that internal tools might miss, providing a truer picture of app reliability. Prioritizing external checks is especially important for lean teams that cannot afford blind spots in the user experience layer.
What are the most common monitoring mistakes fintech startups make?
Relying on outdated metrics, missing cloud-native edge cases, and lacking ownership over monitoring processes are frequent problems. Cloud-specific failures like auto-scaling to zero, cold starts, and load balancer silent failures are frequently missed by teams using monitoring systems designed for traditional infrastructure.
How much can advanced monitoring reduce downtime?
Industry data shows advanced monitoring can cut mean time to recovery by up to 85% and reduce downtime incidents by up to 70%, with structured practices delivering 60% faster incident resolution and 45% fewer outages overall.
Recommended
- Cloud cost optimization strategies for CIOs: a practical guide
- Cloud infrastructure examples: secure, scalable AWS solutions
- Best AWS monitoring tools for cloud performance
- Cloud Infrastructure Explained: Scale, Secure, Optimize AWS
Alexander founded IT-Magic, an AWS Advanced Tier Services Partner delivering DevOps, cloud architecture, and managed services since 2010. He holds:
- AWS Certified Solutions Architect – Professional
- AWS Certified DevOps Engineer – Professional
- AWS Certified Security – Specialty
- AWS Certified Advanced Networking – Specialty
Talk to a certified AWS team trusted by INTERTOP, Foxtrot, Pandora, and J.Hilburn.
Get a free consultation