
TL;DR:
- Failing to monitor your AWS environment introduces significant business risks, including costly downtime and security breaches. A structured, five-phase monitoring lifecycle—covering planning, collection, alerting, dashboards, and incident response—enhances reliability and scalability. Automating and aligning alarms with business context prevent alert fatigue, ensuring faster detection and resolution of issues.
Failing to monitor your AWS environment properly is not just a technical oversight — it is a business risk. Downtime costs organizations an average of $5,600 per minute, and security breaches or compliance failures can multiply that figure many times over. For IT leaders managing complex cloud workloads, reactive monitoring is no longer an option. This guide walks you through a structured, step-by-step process for setting up, deploying, and continuously improving AWS monitoring, so your team can catch problems before users do and maintain the operational control your business demands.
Table of Contents
- Understanding the AWS monitoring process lifecycle
- Preparing your AWS environment for effective monitoring
- Step-by-step: Deploying and configuring AWS monitoring tools
- Handling incidents and root cause analysis with AWS
- Verification and continuous improvement of AWS monitoring
- Our perspective: Why automation and context-driven alerting are game changers
- Get trusted help for AWS monitoring and optimization
- Frequently asked questions
Key Takeaways
Running this on your own AWS setup? IT-Magic is an AWS Advanced Tier Partner — we audit, fix, or fully manage it for you.
Get a free consultation| Point | Details |
|---|---|
| Structured lifecycle | A phased AWS monitoring approach ensures scalability, compliance, and consistent results. |
| Automated, contextual alerts | Combining anomaly detection with composite alarms minimizes noise and boosts incident response. |
| Incident readiness | Integrated dashboards and runbooks streamline rapid issue detection and resolution. |
| Continuous improvement | Frequent reviews and adjustments optimize AWS monitoring for evolving business needs. |
Understanding the AWS monitoring process lifecycle
To act effectively, you first need to understand how AWS monitoring evolves from an initial setup into a robust, scalable operation. Many teams approach monitoring ad hoc — adding alarms as issues surface, building dashboards reactively, and treating logs as an afterthought. That approach breaks down fast as infrastructure grows.
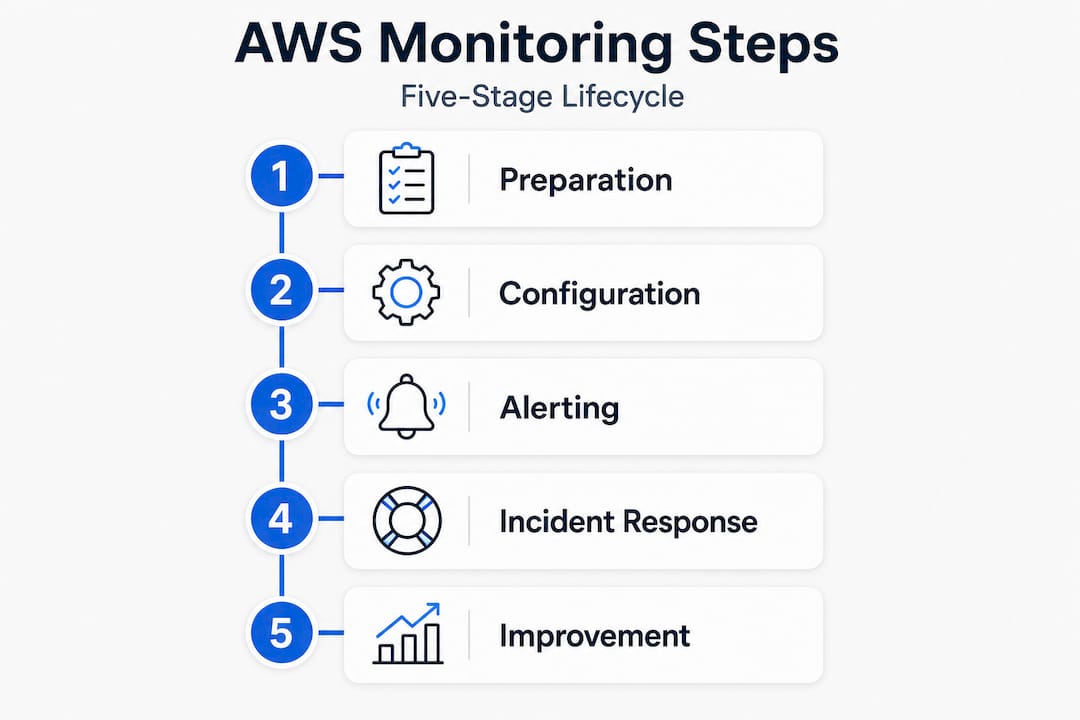
A structured lifecycle approach is far more reliable. The AWS monitoring process for environments typically involves five phases: planning your CloudWatch deployment, collecting metrics, logs, and traces, configuring alarms with anomaly detection, creating actionable dashboards, and integrating incident response runbooks. Each phase builds on the previous one, which means skipping steps leads to gaps that only show up under pressure.
This matters especially for organizations operating at scale or under compliance requirements such as PCI DSS or SOC 2. For example, AWS monitoring for retail environments requires tracking transaction performance alongside security events simultaneously. Without a phased structure, those concerns collide into noise rather than clarity.
| Phase | Key task | Expected outcome |
|---|---|---|
| Planning | Define metrics, logs, and tracing scope | Clear observability strategy |
| Collection | Enable CloudWatch, CloudTrail, X-Ray | Full data visibility |
| Alerting | Set anomaly-based alarms and composite rules | Fewer false positives |
| Dashboards | Build per-team and executive views | Faster incident triage |
| Incident response | Integrate runbooks and escalation paths | Consistent, faster resolution |
The difference between ad hoc and structured monitoring is significant in practice:
- Ad hoc monitoring creates alert fatigue, misses correlated events, and produces dashboards that no one trusts or uses
- Structured monitoring gives teams a shared source of truth, predictable escalation paths, and data that directly informs business decisions
- Compliance coverage is nearly impossible to prove with scattered, undocumented monitoring setups
- Scaling new services is slower when every addition requires manually recreating monitoring logic from scratch
Teams exploring optimizing AWS monitoring for e-commerce or AI-driven workloads should also consult a retail AI monitoring comparison to understand how tooling choices affect long-term observability.
Preparing your AWS environment for effective monitoring
With the phases clear, ensure solid groundwork before launching into setup. Jumping straight to tool configuration without preparing your account structure, permissions, and resource inventory is one of the most common reasons monitoring projects stall or produce incomplete coverage.
Here is a numbered checklist to get your environment ready:
- Audit IAM roles and permissions. Every monitoring service needs precisely scoped access. Create dedicated IAM roles for CloudWatch, CloudTrail, and X-Ray with least-privilege policies. Avoid using overly broad admin roles for monitoring agents.
- Map your resource inventory. You cannot monitor what you do not know exists. Use AWS Config and the Resource Groups Tagging API to catalog all active EC2 instances, RDS databases, Lambda functions, ECS/EKS clusters, and networking components.
- Define your VPC and regional strategy. Decide upfront whether you need cross-region monitoring. CloudWatch supports cross-account and cross-region dashboards, but this requires enabling the right sharing settings in advance.
- Enable AWS CloudTrail across all accounts. CloudTrail records API activity and is foundational for both security monitoring and compliance auditing. Enable it organization-wide via AWS Organizations if you manage multiple accounts.
- Enable AWS X-Ray for distributed tracing. For microservices or containerized workloads, X-Ray provides request-level trace visibility that metric-only monitoring simply cannot replicate.
- Plan your log retention policies. Define CloudWatch Logs retention periods (30 days for debugging, 1 year or longer for compliance) before ingestion begins. Retroactively managing log retention is painful and expensive.
- Review existing alarm setups for gaps or duplication. Before adding new alarms, understand what already exists to avoid conflicting or redundant notifications.
Pro Tip: Use Infrastructure as Code (IaC) tools like Terraform or AWS CloudFormation to deploy your monitoring configuration. Codifying alarms, dashboards, and log groups ensures consistency across environments and makes it trivial to reproduce your monitoring setup when you add new regions or accounts. This is a core recommendation in AWS monitoring best practices and dramatically reduces configuration drift.
Tiered alerting is equally important during preparation. Not every metric deserves a PagerDuty alert at 2 a.m. Structure your alerts into three tiers: informational (logged, no action), warning (Slack notification, review next business day), and critical (immediate on-call escalation). Getting this right from the start, as described in our guide to optimizing monitoring with proven processes, prevents the alert fatigue that causes teams to start ignoring their own monitoring systems.
Step-by-step: Deploying and configuring AWS monitoring tools
With preparation done, walk through how to roll out and fine-tune the critical monitoring tools. This is where theory meets execution.
- Deploy CloudWatch agent on EC2 instances. The default EC2 metrics (CPU, disk I/O, network) are useful but incomplete. The CloudWatch agent adds memory utilization, swap, and disk space metrics that are essential for real operational awareness.
- Configure metric filters on CloudWatch Logs. Parse application and system logs to extract numeric metrics. For example, count HTTP 5xx errors from your load balancer access logs and alarm when they exceed a threshold.
- Create anomaly detection alarms. Rather than guessing a static CPU threshold, use CloudWatch’s anomaly detection to establish a dynamic baseline. The system learns your workload’s normal patterns and alerts only when behavior deviates meaningfully.
- Build composite alarms. Composite alarms combine multiple child alarms using AND/OR logic. For example, alert only when CPU is high AND request latency is elevated, reducing false positives from temporary spikes.
- Set evaluation periods appropriately. For short-lived Lambda functions, use 1-minute evaluation windows. For stable database instances, 5-minute windows reduce noise without sacrificing responsiveness.
- Configure missing data handling for heartbeats. For any service that should always be emitting metrics (like a background worker), treat missing data as “breaching” rather than “ignore.” Silence itself is often the first sign of a failure.
- Suppress alarms during deployments. Use CloudWatch alarm actions or your CI/CD pipeline to temporarily silence alarms during planned maintenance windows, preventing false escalations that erode trust in the system.
- Integrate with your incident management platform. Connect SNS topics to tools like PagerDuty or Opsgenie for structured on-call routing.
| Threshold type | Behavior | Best use case |
|---|---|---|
| Static threshold | Fixed value triggers alarm | Predictable, constant workloads |
| Anomaly detection | Dynamic baseline, deviation triggers alarm | Variable, seasonal, or growing workloads |
| Composite alarm | Multiple conditions required | Reducing false positives on correlated issues |
Following AWS best practices, expert teams use composite alarms and anomaly detection over static thresholds, treat missing data as breaching for heartbeat services, and suppress alarms during deployments to prevent noise from eroding responder trust.
Pro Tip: If you use PagerDuty or Opsgenie, route different alarm tiers to different escalation policies. Critical alarms wake up on-call engineers. Warning alarms go into a ticket queue for next-day review. This simple separation dramatically improves responder focus and prevents burnout. Our experience supporting teams with scaling AWS monitoring tools confirms this is one of the highest-leverage changes you can make.
For teams looking to push further, the full walkthrough of cloud performance optimization covers advanced configurations including container-level metrics for EKS and ECS workloads.
Handling incidents and root cause analysis with AWS
Once tooling is in place, you need to be prepared for what happens when an anomaly or failure is detected. A fast, consistent incident response process is what separates teams that recover in minutes from those that recover in hours.
Here is a structured incident response flow:
- Recognize. An alarm fires. The on-call engineer receives a notification via PagerDuty or Opsgenie and opens the relevant CloudWatch dashboard to assess scope.
- Triage. Use X-Ray service maps and CloudWatch dashboards to determine whether this is isolated to one component or cascading across services. Prioritize based on customer impact.
- Investigate. Run CloudWatch Logs Insights queries to search log data in seconds across millions of events. Use CloudWatch Investigations AI to surface correlated anomalies and root causes automatically. Apply 5 Whys analysis within your runbook to avoid stopping at the symptom.
- Resolve. Execute the appropriate runbook action — whether that means scaling an Auto Scaling group, restarting a service, rolling back a deployment, or escalating to a database administrator.
- Document. Write a concise incident report immediately after resolution while the details are fresh.
Common AWS issues your monitoring should track:
- Performance degradation: high latency, CPU throttling, memory pressure, disk I/O saturation
- Cost anomalies: unexpected EC2 or data transfer spikes, forgotten resources running at scale
- Security events: unusual API calls in CloudTrail, unauthorized access attempts, IAM policy changes
- Compliance drift: disabled logging, unencrypted volumes, security group rule changes
- Availability failures: instance health check failures, load balancer unhealthy host counts, RDS failover events
Incident reports are not just retrospective paperwork. They are one of the most valuable inputs for improving your monitoring setup over time. Each report surfaces gaps in alerting coverage, runbook quality, or escalation routing that can be systematically fixed before the next incident occurs.
For organizations handling payments or sensitive customer data, proper AWS incident response for ecommerce is especially critical. Understanding incident handling in retail payment systems illustrates how the stakes intensify when financial transactions are involved.
Verification and continuous improvement of AWS monitoring
With incident response in place, focus shifts to maintaining and perfecting your monitoring process. Monitoring is not a one-time setup. Infrastructure changes, traffic patterns shift, and new services get deployed. Your monitoring must evolve alongside them.
Regular practices that keep monitoring sharp:
- Run scheduled test scenarios. Intentionally trigger alarms in non-production environments monthly to verify that notifications fire, escalation routing works, and runbooks are accurate. Many teams discover broken alert routing only during a real incident.
- Review dashboards quarterly. Remove metrics no one looks at. Add visibility for new services. Dashboards that fall out of sync with reality create false confidence.
- Tune alarms based on incident history. After every significant incident or false alarm, ask: did the right alarm fire? Was it too early, too late, or not at all? Adjust thresholds and composite rules accordingly.
- Hold monthly lessons-learned sessions. Invite engineers, product managers, and business stakeholders to review incident trends and monitoring gaps together. Cross-functional input often surfaces business-impact metrics that pure infrastructure teams miss.
- Update runbooks after every incident. A runbook that does not reflect the current system architecture is worse than no runbook, because it creates false confidence and wastes response time.
- Solicit feedback from stakeholders. Ask your engineering leads, finance team (for cost anomalies), and security officers whether the current monitoring setup meets their needs. Their requirements evolve, and your monitoring should reflect that.
Generating incident reports through CloudWatch Investigations provides structured data that makes these review sessions far more productive, surfacing patterns that would be invisible from raw log review alone.
Working with top AWS partners for optimization can accelerate this improvement cycle, especially for teams that lack dedicated Site Reliability Engineering (SRE) capacity in-house.

Our perspective: Why automation and context-driven alerting are game changers
With the framework explained, here is what most companies still miss in their AWS monitoring practice.
The biggest monitoring failure we see is not technical — it is organizational. Teams invest weeks setting up CloudWatch dashboards and alarms, then slowly stop looking at them. The reason is almost always alert fatigue combined with a lack of business context. An alarm that fires 40 times a day for a metric that never caused a real incident stops meaning anything. Engineers learn to ignore it.
The fix is not more alarms or fancier dashboards. It is deliberate curation. Every alarm should answer a specific business question: is this service unavailable for customers? Is this cost spike eroding margin? Is this API call pattern a sign of credential compromise? When alarms lack that context, they become noise. When they carry that context, they become action triggers.
Automation is the other side of this coin. Manual rule maintenance does not scale. As your infrastructure grows from dozens to hundreds of services, static alarm configurations become liabilities. Automated anomaly detection, IaC-managed alarm definitions, and self-healing Auto Scaling policies are not nice-to-haves — they are the only way to maintain monitoring quality at scale without burning out your team.
We have seen this play out repeatedly across fintech and enterprise clients. The teams that maintain excellent AWS operations are not the ones with the most complex monitoring setups. They are the ones with the most disciplined ones: fewer, better alarms; automated deployment of monitoring config; and a quarterly habit of reviewing what is actually firing and why.
Pro Tip: Review your CloudWatch alarm history every quarter. Pull a report of the most frequently triggered alarms over the past 90 days. Any alarm that fired more than 50 times without resulting in a meaningful incident should be tuned, suppressed, or removed. Noisy alarms are not neutral — they actively degrade your team’s ability to respond to real issues. Our AWS cost optimization insights show similar patterns: undisciplined monitoring setups often correlate directly with undisciplined cost structures.
Get trusted help for AWS monitoring and optimization
Implementing a mature AWS monitoring practice takes time, expertise, and ongoing commitment. Many engineering teams have the talent but lack the dedicated bandwidth to build and maintain a monitoring setup that actually scales with the business.
At IT-Magic, we have delivered AWS optimization and monitoring solutions for 300+ clients across fintech, retail, and enterprise sectors since 2010. Our certified AWS engineers handle everything from initial CloudWatch architecture to automated alarm management and incident response integration. We also provide full Kubernetes support for teams running containerized workloads on EKS or ECS. Whether you need a monitoring audit, a greenfield setup, or ongoing managed operations, we act as your dedicated DevOps and cloud partner. Visit IT-Magic to explore how we can help your team achieve operational excellence without the overhead of building it alone.
Frequently asked questions
What are the most critical AWS metrics to monitor first?
Start with CPU, memory, disk usage, network throughput, and error rates for EC2, RDS, and core services. These cover the fundamentals of any phased monitoring approach before expanding to application-level and business metrics.
How is anomaly detection better than static thresholds?
Anomaly detection dynamically adapts to real usage patterns and reduces false alarms compared to fixed limits. AWS recommends anomaly detection over static thresholds especially for variable workloads where traffic scales with time of day or seasonal demand.
How do you avoid alert fatigue when monitoring AWS?
Use tiered alerting and composite alarms, and run quarterly reviews to tune or disable notifications that consistently fire without driving action. The goal is fewer, higher-quality alerts that your team actually trusts.
What’s the role of runbooks in AWS incident response?
Runbooks provide step-by-step instructions for IT teams, reducing recovery time and improving consistency during incidents. Integrated with CloudWatch Investigations, they become the backbone of repeatable, measurable incident resolution.
Recommended
- The CTO’s guide to securing AWS infrastructure for scale
- AWS cloud operations tutorial: optimize and scale smart
- How to automate cloud operations for scalable AWS
- AWS Cloud Security: Best Practices, Tools & Complete Guide | IT-Magic
Alexander founded IT-Magic, an AWS Advanced Tier Services Partner delivering DevOps, cloud architecture, and managed services since 2010. He holds:
- AWS Certified Solutions Architect – Professional
- AWS Certified DevOps Engineer – Professional
- AWS Certified Security – Specialty
- AWS Certified Advanced Networking – Specialty
Talk to a certified AWS team trusted by INTERTOP, Foxtrot, Pandora, and J.Hilburn.
Get a free consultation

