
TL;DR:
- Cloud observability enables understanding of system behavior through telemetry analysis, revealing root causes of failures. It integrates metrics, logs, and traces to provide comprehensive insights, especially in complex distributed environments, surpassing traditional monitoring. Building observability from the start and combining automated correlation enhances incident response efficiency and security visibility.
Cloud observability is the capability to understand the internal state and behavior of cloud systems by analyzing external telemetry, specifically metrics, logs, and traces. Where traditional monitoring tells you something is wrong, observability tells you why. Platforms like Google Cloud Observability, Dynatrace, and Datadog have made this discipline central to modern cloud operations. IT downtime costs between $5,600 and $300,000 per hour depending on the industry, which makes the ability to detect and diagnose failures fast a direct business priority, not just an engineering concern.
What is cloud observability and why does it matter?
Cloud observability is the practice of inferring a system’s internal state from the data it produces externally. The term comes from control theory, but in cloud engineering it refers to a specific discipline: collecting, correlating, and analyzing telemetry across distributed infrastructure to answer questions your dashboards were never designed to ask.

The three pillars of observability are metrics, logs, and traces. Each one captures a different dimension of system behavior, and together they give engineering teams the full picture needed to diagnose failures in complex environments. Observability combines metrics, logs, and traces to answer why failures happen, including failure modes that traditional monitoring misses entirely.
The importance of observability grows directly with system complexity. A monolithic application running on a single server is easy to monitor. A distributed system running across dozens of AWS Lambda functions, EKS pods, and third-party APIs is not. That is precisely the environment most engineering teams operate in today.
What are the core pillars and how do they work together?
Running this on your own AWS setup? IT-Magic is an AWS Advanced Tier Partner — we audit, fix, or fully manage it for you.
Get a free consultationThe three telemetry types are not interchangeable. Each one answers a different question, and each one is most useful when combined with the others.
Metrics are numerical measurements collected at regular intervals. CPU utilization, request latency, error rates, and memory consumption are all metrics. They are cheap to store, easy to visualize, and excellent for detecting that a problem exists.
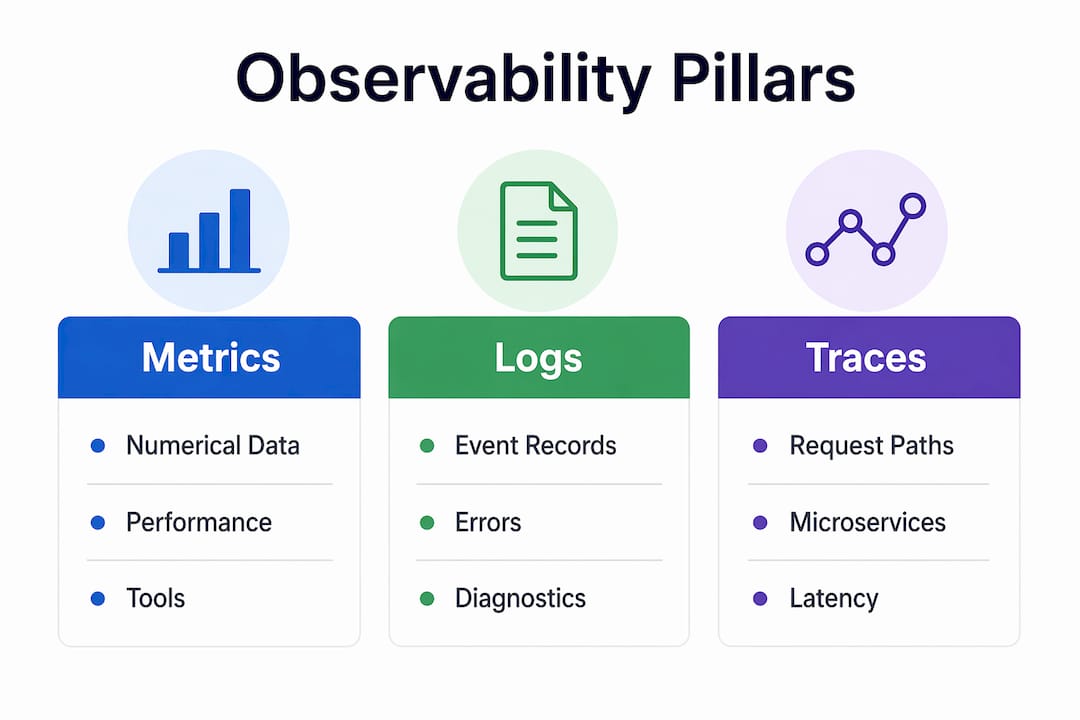
Logs are time-stamped records of discrete events. A failed authentication attempt, a database query timeout, or an unhandled exception each produces a log entry. Logs provide the narrative context that metrics cannot. When a latency spike appears in your metrics, the logs tell you which specific request failed and what the system was doing at that moment.
Traces record the path of a single request as it travels through multiple services. In a microservices architecture, a single user action might touch ten different services before returning a response. A trace links all of those spans together, so you can see exactly where latency was introduced or where a failure originated.
| Telemetry Type | Data Format | Primary Use Case | Example Tool |
|---|---|---|---|
| Metrics | Numerical time series | Detect anomalies and set alerts | Prometheus, CloudWatch |
| Logs | Text or structured events | Diagnose specific failures | Elasticsearch, CloudWatch Logs |
| Traces | Distributed request paths | Identify latency across services | AWS X-Ray, Jaeger |
Pro Tip: Do not treat these three pillars as separate pipelines. The real power comes from correlation: link a metric alert to the relevant log entries and the trace that shows the full request path. Tools like Datadog and Dynatrace do this automatically, which cuts mean time to resolution significantly.
How does cloud observability differ from traditional monitoring?
Monitoring and observability solve different problems. Understanding the distinction prevents teams from investing in one while expecting the results of the other.
Traditional cloud monitoring works by tracking predefined metrics against fixed thresholds. If CPU usage exceeds 80%, an alert fires. If a health check fails, an incident opens. Monitoring is excellent at detecting known failure modes. It is the early warning system for your infrastructure.
Observability goes further. Teams can investigate unknown behavioral patterns rather than just track known thresholds. This matters because the most damaging failures in distributed systems are often the ones nobody anticipated. A subtle memory leak across a fleet of containers, a cascading timeout caused by a third-party API, or a race condition that only appears under specific load patterns will not trigger a predefined alert. Observability gives you the tools to find and explain those failures after the fact.
The practical difference looks like this:
- Monitoring tells you that error rates on your checkout service spiked at 2:14 AM.
- Observability tells you that the spike was caused by a downstream payment API returning 503s, which triggered a retry storm, which exhausted connection pool limits on three separate services.
Monitoring and observability are complementary: monitoring provides early warnings while observability explains unknown issues. You need both. The mistake is treating monitoring as sufficient for complex cloud-native architectures.
Pro Tip: If your team spends more than 30 minutes per incident just figuring out where to look, that is a signal your observability coverage is insufficient. Monitoring tells you something broke. Observability tells you where and why.
What challenges do IT teams face implementing observability?
Modern cloud environments create specific technical obstacles that make observability harder than it sounds in theory.
1. Ephemeral infrastructure
Containers and serverless functions spin up and disappear in seconds. Ephemeral resources often vanish before issues can be investigated manually. If your telemetry pipeline does not persist data beyond the lifecycle of the resource that generated it, you lose the evidence you need for post-incident analysis. Observability platforms must aggregate and store telemetry independently of the infrastructure that produced it.
2. Data volume and cost
A large microservices deployment can generate billions of telemetry events per day. Collecting 100% of telemetry data can be cost-prohibitive. The challenge is not just collecting data but retaining the right data at a cost that does not consume your entire infrastructure budget. Teams need sampling strategies, tiered storage, and clear retention policies.
3. Scale beyond human analysis
Hundreds of microservices, each emitting metrics, logs, and traces, produce more signal than any team can manually review. AI-augmented observability tools help analyze hundreds of microservices and correlate telemetry across the full stack. Without AI-powered anomaly detection and automated correlation, the volume of data becomes noise rather than insight.
4. Security visibility gaps
Standard telemetry captures application behavior but often misses the security context needed to detect attacks. Security-aware observability integrates telemetry of resource relationships, identity permissions, and network paths to detect complex attacks. This approach surfaces risky behaviors that logs alone cannot reveal, such as a compromised service account making unusual API calls across multiple AWS regions.
Observability without security context is incomplete. In cloud environments where identity is the perimeter, understanding who accessed what and how is as important as understanding why a service is slow.
What are the best practices for implementing cloud observability?
Getting observability right requires deliberate architectural decisions, not just tool selection.
Build it in from the start
Observability should be integrated in the architectural design phase, not retrofitted after deployment. The AWS Well-Architected Framework treats observability as a foundational pillar, not an optional add-on. Teams that instrument their services from day one can automate remediation workflows and reduce incident response time. Teams that add observability later spend months backfilling instrumentation and still have blind spots.
Choose platforms that unify all three pillars
Separate tools for metrics, logs, and traces create correlation friction. When an alert fires at 3 AM, the last thing your on-call engineer needs is to pivot between three different interfaces. Platforms like Datadog, Dynatrace, and AWS CloudWatch with X-Ray integration provide unified views that connect all three telemetry types in a single workflow. For teams already on AWS, pairing CloudWatch with AWS X-Ray and OpenTelemetry gives strong native coverage without additional vendor costs.
Automate correlation and reduce alert noise
Raw telemetry volume is not the goal. Actionable signal is. Configure automated correlation rules that group related alerts into single incidents. Set dynamic thresholds rather than static ones to reduce false positives during expected traffic spikes. The cloud infrastructure monitoring practices that work at scale rely on intelligent alerting, not more dashboards.
Manage telemetry costs deliberately
Telemetry cost is a real constraint. Use sampling for high-volume trace data while retaining 100% of error traces. Tier your log storage so that recent logs stay in fast, queryable storage while older logs move to cheaper archival tiers. Teams that apply these strategies can reduce cloud spend by 15–20% by identifying and eliminating waste that would otherwise go unnoticed.
Pro Tip: Start with security best practices baked into your observability design. Tagging resources consistently from the start makes it far easier to correlate telemetry with identity and permission data later, which is critical for both debugging and security investigations.
Key takeaways
Effective cloud observability requires unified telemetry across metrics, logs, and traces, built into the architecture from day one, with AI-powered correlation and security context to handle the scale and complexity of modern distributed systems.
| Point | Details |
|---|---|
| Observability vs. monitoring | Monitoring detects known failures; observability explains unknown ones through telemetry correlation. |
| Three core pillars | Metrics, logs, and traces each answer different questions and must be used together for full visibility. |
| Ephemeral infrastructure risk | Telemetry must persist beyond container or serverless lifecycles to support post-incident analysis. |
| AI is not optional at scale | Hundreds of microservices generate more signal than humans can process without automated correlation. |
| Design-phase integration | Retrofitting observability misses automation benefits; the AWS Well-Architected Framework treats it as foundational. |
Why observability is the discipline that separates good teams from great ones
After working with distributed cloud systems across dozens of production environments, the pattern I see most often is this: teams invest heavily in monitoring, get burned by an incident that monitoring could not explain, and then scramble to add observability after the fact. That scramble is expensive and slow.
The teams that handle incidents well are the ones that treated observability as infrastructure, not tooling. They instrumented their services before they needed the data. They built correlation into their alerting pipelines before the 3 AM call. They connected security telemetry to application telemetry before the audit.
What surprises most engineers is how much observability changes the culture of incident response. When you can answer “why did this fail?” in minutes instead of hours, post-mortems become learning exercises rather than blame sessions. Mean time to resolution drops. On-call rotations become less brutal. Engineers trust their systems more because they understand them better.
The next frontier is automated remediation. Observability platforms are already integrating with infrastructure-as-code tools to trigger automated rollbacks, scaling events, and configuration changes when telemetry signals a specific failure pattern. Teams that have built clean, well-instrumented observability pipelines today will be the first to benefit from that automation tomorrow.
Monitoring alone will not get you there. Observability will.
— Oleksandr
How IT-Magic helps you build observability-driven cloud infrastructure
IT-Magic has delivered 700+ AWS projects since 2010, and observability is central to how we design and operate cloud infrastructure for clients across fintech, retail, and enterprise. We help engineering teams instrument their AWS environments correctly from the start, connecting CloudWatch, X-Ray, and OpenTelemetry into unified pipelines that reduce incident response time and control telemetry costs. The Intertop case study shows how IT-Magic helped a major retail client cut AWS spend while improving infrastructure reliability through observability-driven optimization. If your team is dealing with blind spots, alert fatigue, or runaway cloud costs, we can help you build the foundation to fix all three.
FAQ
What is cloud observability in simple terms?
Cloud observability is the ability to understand what is happening inside your cloud systems by analyzing the data those systems produce externally, specifically metrics, logs, and traces.
How is cloud observability different from cloud monitoring?
Monitoring tracks known conditions against predefined thresholds and alerts when they are breached. Observability investigates unknown failures by correlating telemetry to explain root causes that monitoring cannot surface.
What are the three pillars of cloud observability?
The three pillars are metrics (numerical measurements like CPU and latency), logs (time-stamped event records), and traces (distributed request paths across microservices). Each one answers a different question about system behavior.
Which tools are commonly used for cloud observability?
Datadog, Dynatrace, and AWS-native tools including CloudWatch, X-Ray, and OpenTelemetry are widely used. The best choice depends on your existing AWS footprint and whether you need a unified platform or can manage separate tools.
When should a team implement cloud observability?
Observability should be built into the architectural design phase. Retrofitting it after deployment is possible but significantly more expensive and leaves gaps that only appear during production incidents.
Recommended
- Cloud Monitoring Process: A 2026 Guide for IT Teams
- What is cloud compliance: A guide for IT decision-makers
- What Is Cloud Risk Management: A 2026 Guide for Leaders
- Cloud Resilience Explained for IT Leaders in 2026
Alexander founded IT-Magic, an AWS Advanced Tier Services Partner delivering DevOps, cloud architecture, and managed services since 2010. He holds:
- AWS Certified Solutions Architect – Professional
- AWS Certified DevOps Engineer – Professional
- AWS Certified Security – Specialty
- AWS Certified Advanced Networking – Specialty
Talk to a certified AWS team trusted by INTERTOP, Foxtrot, Pandora, and J.Hilburn.
Get a free consultation

