
TL;DR:
- DevOps monitoring is a continuous feedback system that improves deployment frequency, reduces failure rates, and accelerates incident resolution. Elite teams leverage comprehensive, automated monitoring across applications, infrastructure, security, and business metrics, integrating it into their pipelines for proactive improvements. Implementing effective monitoring practices directly enhances performance, cost efficiency, and organizational resilience in high-velocity environments.
The performance gap between DevOps leaders and everyone else is staggering. Elite teams deploy 208x more frequently and suffer 3x lower change failure rates than low performers, and advanced monitoring sits at the core of that advantage. DevOps monitoring means continuously collecting, analyzing, and acting on data about your software, infrastructure, and pipelines so you always know what’s working and what isn’t. For IT leaders at startups and enterprises alike, understanding how to implement it well is the difference between teams that ship confidently and teams that fight fires constantly.
Table of Contents
- What is monitoring in DevOps?
- How DevOps monitoring drives performance: Metrics that matter
- Key monitoring strategies and tools for DevOps teams
- Real-world impact: Monitoring success stories and cloud cost optimization
- Rethinking DevOps monitoring: What most teams miss
- How IT-Magic can help you master DevOps monitoring
- Frequently asked questions
Key Takeaways
Running this on your own AWS setup? IT-Magic is an AWS Advanced Tier Partner — we audit, fix, or fully manage it for you.
Get a free consultation| Point | Details |
|---|---|
| Monitoring explained | Monitoring in DevOps means continuously tracking system health for faster, safer delivery. |
| Metrics impact results | Focusing on key metrics like lead time and MTTR can drive massive performance improvements. |
| Cost optimization | Effective monitoring supports predictive scaling and can lower cloud spending by up to 25%. |
| Mindset matters | Viewing monitoring as a strategic enabler, not just an alert tool, fosters innovation and resilience. |
What is monitoring in DevOps?
DevOps monitoring is not just a dashboard showing CPU usage. It is a continuous feedback system that spans every layer of your technology stack, feeding real-time intelligence back into your engineering and business cycles. The goal is to detect problems before users do, accelerate incident response, and use data to drive improvement over time.
The core components of DevOps monitoring include:
- Application monitoring: Tracks response times, error rates, throughput, and latency across services and APIs. This tells you whether your code is actually performing in production.
- Infrastructure monitoring: Covers compute, network, storage, and cloud resources. It answers questions like “Is my database running out of connections?” or “Is my Kubernetes node overloaded?”
- Security monitoring: Continuously scans for unauthorized access, anomalous behavior, and compliance violations. In regulated industries like fintech, ignoring this layer is not an option.
- Business monitoring: Tracks KPIs like conversion rates, checkout completions, or transaction volumes. A spike in failed payments is often a technical problem in disguise.
Traditional IT monitoring was reactive: something broke, an alert fired, someone fixed it. DevOps monitoring is proactive. It integrates directly into your CI/CD pipeline so you catch regressions at the deployment stage rather than hours after a production outage. You instrument your code, automate alerting, and feed metrics directly into deployment gates. This approach to monitoring for flawless operation means issues surface when they are cheapest to fix, not when customers are already affected.
The business case is concrete. Elite monitoring practices enable 2x delivery velocity at half the failure rate, with case studies showing 40% faster MTTR and 25% cloud cost reduction through predictive scaling and anomaly detection. For high-velocity teams shipping dozens of releases per week, that is a compounding advantage that widens every quarter.
Pro Tip: Don’t instrument only in production. Build monitoring into your staging and testing environments. Catching performance regressions before they reach prod is far less expensive than incident management.
How DevOps monitoring drives performance: Metrics that matter
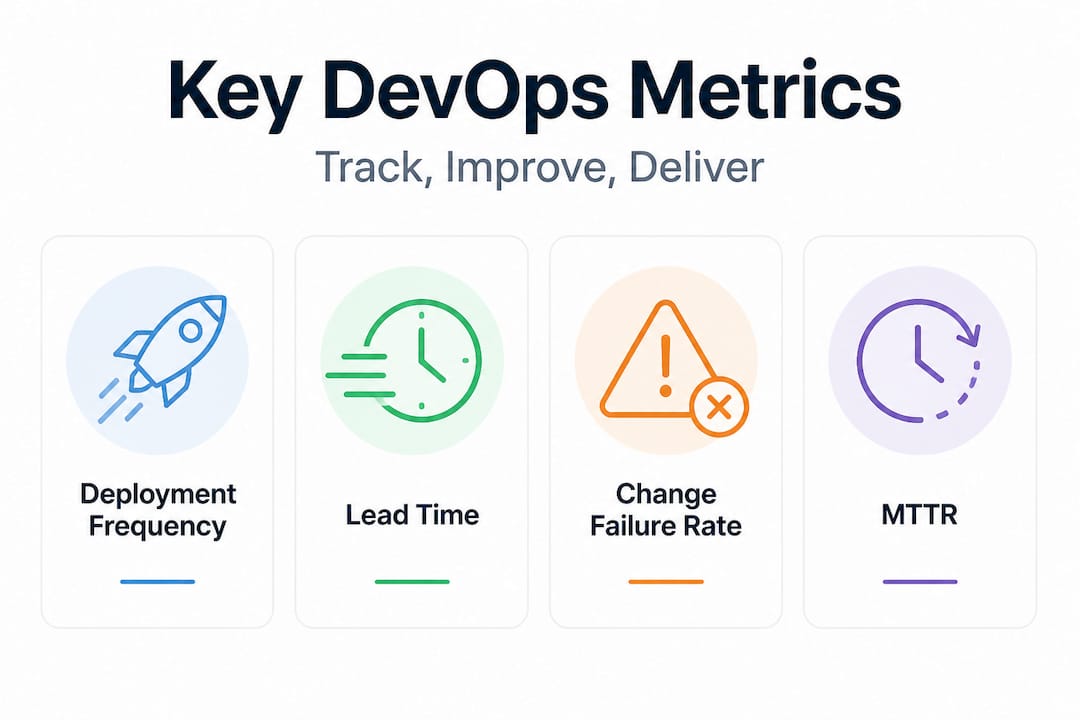
Understanding monitoring in theory is one thing. Knowing which numbers to track to actually move the needle for your business is another. The most widely adopted framework for measuring DevOps performance comes from the DORA (DevOps Research and Assessment) research program, which identifies four key metrics that predict organizational outcomes.
Deployment Frequency measures how often your team ships code to production. High frequency means you are delivering value continuously and catching bugs in small batches rather than in large, risky releases.
Lead Time for Changes tracks the time from code commit to running in production. Shorter lead times mean your pipeline is efficient and your feedback loops are tight.
Change Failure Rate is the percentage of deployments that cause a degraded service or require a hotfix. Lower is obviously better, and monitoring is the primary tool for detecting regressions before they become failures.
Mean Time to Restore (MTTR) measures how quickly you recover from an incident. DORA metrics benchmarks for elite teams show that elite performers recover in under an hour, while low performers take days.

Here’s how the performance gap looks across these metrics:
| Metric | Elite teams | High performers | Medium performers | Low performers |
|---|---|---|---|---|
| Deployment frequency | On-demand (multiple/day) | Weekly to monthly | Monthly | 1x per 6 months |
| Lead time for changes | Less than 1 hour | 1 day to 1 week | 1 week to 1 month | Over 6 months |
| Change failure rate | 0 to 15% | 16 to 30% | 16 to 30% | 16 to 30% |
| MTTR | Less than 1 hour | Less than 1 day | Less than 1 day | Over 1 week |
“Organizations that invest in monitoring infrastructure capable of surfacing real-time DORA metrics gain a compounding competitive advantage: faster delivery cycles, higher quality, and significantly lower operational risk.”
Monitoring is what makes tracking these metrics possible. Without instrumentation across your pipelines and infrastructure, MTTR is just a guess. With it, you can pinpoint the failing service, correlate it with the last deployment, and roll back or patch in minutes.
The practical payoffs are significant. Teams that deploy handling high load with AWS architectures tied to robust monitoring have demonstrated 40% faster incident resolution and meaningful reduction in outage frequency. For an e-commerce platform handling Black Friday traffic, that improvement directly translates to revenue protected.
Pro Tip: Start tracking your own DORA metrics before you try to improve them. You cannot manage what you don’t measure. Even a rough baseline reveals where your biggest bottlenecks are hiding.
Consider DevOps for retail operations as a concrete example. Retailers with tight monitoring pipelines can detect a payment gateway slowdown at 2 AM, auto-scale the affected service, and resolve the issue before the morning shopping surge. Teams without monitoring discover the problem when customer complaints flood support tickets.
Key monitoring strategies and tools for DevOps teams
Knowing what to measure is half the battle. Actually implementing monitoring in a way that scales, stays actionable, and avoids alert fatigue is where most teams struggle. Here is a structured approach that works for both startups and enterprises.
Core implementation steps:
-
Define your SLOs and SLIs first. Service Level Objectives (SLOs) and Service Level Indicators (SLIs) clarify what “healthy” means for your system. Without these, you have no basis for meaningful alerting. An SLO might be “99.9% of API requests return within 300ms.” An SLI is the actual measured rate.
-
Instrument everything from day one. Add structured logging, metrics emission, and distributed tracing to every service. Use OpenTelemetry as a vendor-neutral standard so you are not locked into a single tool.
-
Centralize visibility. A single observability platform where all logs, metrics, and traces converge eliminates blind spots. Engineers should be able to answer any production question from one place.
-
Automate alerting with routing logic. Alerts must be actionable and routed to the right person. A database alert should page the database engineer, not the entire team. Use on-call management tools like PagerDuty to enforce this.
-
Build dashboards for different audiences. Engineers need low-level service health views. Leaders need business KPI dashboards. Both should update in real time.
-
Integrate monitoring into your CI/CD pipeline. Automated tests should include performance checks. A deployment that causes latency to spike 40% should be automatically flagged or rolled back.
Here’s how common monitoring tools compare for cloud-native teams:
| Tool | Best fit | Key strengths | Cost model | AWS integration |
|---|---|---|---|---|
| AWS CloudWatch | AWS-native startups and enterprises | Tight AWS integration, log insights, alarms | Pay-per-use, can grow costly | Native |
| Prometheus + Grafana | Kubernetes-heavy teams | Open-source, flexible, great for Kubernetes | Infrastructure cost only | Via exporters |
| Datadog | Mid-market to enterprise | Full-stack observability, APM, easy setup | Per-host or usage-based licensing | Strong |
| New Relic | Enterprises with complex apps | Deep APM, full-stack telemetry, AIOps | Consumption-based | Good |
Case studies show 40% improvement in incident response when teams adopt robust, centralized monitoring tied to automated alerting. The tool matters less than the discipline of instrumenting comprehensively and acting on what the data tells you.
The most common pitfalls we see are over-alerting (which leads to engineers ignoring pages), under-instrumented microservices (so incidents take forever to isolate), and completely ignoring security signals until after a breach. Treat security monitoring as a first-class citizen alongside performance metrics, especially if you operate in fintech or handle PII.
Pro Tip: Set alert thresholds based on historical baselines, not arbitrary numbers. An alert that fires when CPU hits 80% is meaningless if your service routinely runs at 75%. Alert on deviation from normal, not on absolute values.
Real-world impact: Monitoring success stories and cloud cost optimization
The business case for monitoring becomes clearest when you look at what happens with and without it in high-stakes scenarios.
Here are patterns we consistently see across cloud-heavy organizations that have invested in proper monitoring:
- E-commerce platforms avoiding Black Friday outages: Teams that instrument their auto-scaling triggers with predictive monitoring detect traffic surges 15-20 minutes before they breach capacity thresholds. They scale proactively instead of reactively, preventing the outage that would otherwise cost thousands of dollars per minute in lost revenue.
- Anomaly detection cutting security incident costs: Organizations running continuous security monitoring catch unauthorized credential use within minutes rather than days. The average cost of a breach discovered through monitoring is significantly lower than one discovered by customers or external researchers.
- Right-sizing reducing cloud waste: Many teams overprovision servers to handle theoretical peak loads. Monitoring reveals actual usage patterns, enabling teams to right-size instances and eliminate idle resources.
- Proactive database performance management: Monitoring query performance and connection pool utilization allows teams to address slow queries and index problems before they cascade into application-level failures.
The financial impact of intelligent monitoring on monitoring for AWS cost savings is well documented. Predictive scaling and anomaly detection reduce cloud costs by 25% on average. For a company spending $500,000 per year on AWS, that is $125,000 back in the budget annually, money that can fund two additional engineers or accelerate a product roadmap.
A good example of this in practice is the cloud cost reduction at Foxtrot, where systematic monitoring of resource utilization tied to automated scaling policies produced meaningful cost savings without sacrificing availability.
The feedback loop is what makes this sustainable. Monitoring data flows into your engineering process, informs architecture decisions, and shapes how you provision resources. This is not a one-time optimization. It is a compounding improvement cycle. Teams that close this loop effectively treat monitoring data the same way a product team treats user analytics: as a continuous source of actionable truth.
For CTOs and CIOs focused on budget efficiency, this framing matters. The right framework for cost optimization for CIOs puts monitoring at the center of financial governance, not just operational reliability.
Rethinking DevOps monitoring: What most teams miss
After working on 700+ infrastructure projects, we have noticed a consistent pattern. Most organizations treat monitoring as a reactive insurance policy. They set it up to catch outages, and that’s about it. The teams that genuinely pull ahead use monitoring as a strategic engineering asset.
The real shift is conceptual. When monitoring data feeds directly into sprint planning, deployment decisions, and architecture reviews, it stops being a cost center and becomes a growth lever. You are not just watching systems; you are learning from them in real time. Elite teams use monitoring for proactive improvement, not just failure detection, and the DORA data makes clear that this mindset difference has measurable performance consequences.
The hard-won lesson from monitoring during AWS migration projects is this: teams that decouple their monitoring strategy from their delivery pipeline end up with data they cannot act on. Alerts fire, engineers investigate, but there is no structured path from “monitoring flagged this” to “we changed how we deploy because of it.” That gap is where elite potential gets wasted.
Monitoring should be the nervous system of your delivery process, not a separate organ you check when something hurts.
How IT-Magic can help you master DevOps monitoring
If the principles above resonate but the implementation feels complex, you are not alone. Most IT teams have the intent but lack the bandwidth or specialized expertise to build monitoring that actually drives the outcomes described here.
At IT-Magic, we have been designing and operating AWS environments since 2010, and monitoring is always central to how we build reliable infrastructure. Whether you need end-to-end AWS infrastructure support, targeted AWS cost optimization through smarter resource monitoring, or observability wired into your Kubernetes support services, we bring certified engineers who have solved these problems across fintech, retail, and enterprise environments. We don’t just configure tools. We build feedback loops that make your entire engineering organization faster and more resilient.
Frequently asked questions
Why is monitoring critical in DevOps?
Monitoring provides real-time insights that enable early detection of issues, faster recovery, and continuous improvement for resilient software delivery. Elite monitoring practices enable 2x delivery velocity at half the failure rate compared to teams without strong observability practices.
What are DORA metrics and why do they matter?
DORA metrics are industry-standard benchmarks used to measure DevOps performance across deployment frequency, lead time, change failure rate, and MTTR. DORA benchmarks for elite teams show monitoring directly drives faster deployments and lower failure rates.
How does monitoring reduce cloud costs?
Proactive monitoring detects resource misuse and enables predictive scaling, which can cut cloud expenses by up to 25%. Predictive scaling via anomaly detection removes the guesswork from capacity planning and eliminates idle resource spend.
What types of monitoring are essential for DevOps success?
Application, infrastructure, security, and business monitoring are all vital for complete, actionable visibility. Missing any one layer creates blind spots that surface as either unexpected outages, cost overruns, or security incidents.
Recommended
- AWS DevOps explained: accelerate delivery and scale securely
- DevOps in cloud: drive agility and 72% cost savings
- Cloud-Native DevOps Explained: Accelerate Delivery and Cut Costs
- CI/CD in DevOps: 127x Faster Software Delivery
- Continuous Monitoring: Your Always‑On Cyber Defense – Heights Consulting Group
- Streamline security monitoring and automation for compliance
Alexander founded IT-Magic, an AWS Advanced Tier Services Partner delivering DevOps, cloud architecture, and managed services since 2010. He holds:
- AWS Certified Solutions Architect – Professional
- AWS Certified DevOps Engineer – Professional
- AWS Certified Security – Specialty
- AWS Certified Advanced Networking – Specialty
Talk to a certified AWS team trusted by INTERTOP, Foxtrot, Pandora, and J.Hilburn.
Get a free consultation

